
Executive Summary
MyDoom is an infamous computer worm first noted in early 2004. This malware has been featured in top ten lists of the most destructive computer viruses, causing an estimated $38 billion in damage. Although now well past its heyday, MyDoom continues to be a presence in the cyber threat landscape.
While not as prominent as other malware families, MyDoom has remained relatively consistent during the past few years, averaging approximately 1.1 percent of all emails we see with malware attachments. We continue to record tens of thousands of MyDoom samples every month. The vast majority of MyDoom emails come from IP addresses registered in China, with the United States running a distant second. These emails are sent to recipients across the world, mostly targeting high tech, wholesale, retail, healthcare, education, and manufacturing industries.
This blog tracks MyDoom activity in recent years and focuses on trends during the first six months of 2019.
2015 through 2018
MyDoom's method of propagation is through email using SMTP. We compared emails containing MyDoom attachments with emails containing any type of malware attachment. In the four-year period from 2015 through 2018, an average of 1.1 percent of malicious emails contained MyDoom. When reviewing individual malware samples during the same period, MyDoom held an average of 21.4 percent for all individual malware attachments seen through malicious emails.
Why is the percentage of MyDoom emails so much lower than the percentage of MyDoom attachments? Because many malicious email campaigns carry the same malware sample across messages to hundreds or thousands of recipients. MyDoom is polymorphic and tends to have different file hashes for each of the emails we find. Therefore, while the number of MyDoom emails is relatively low, the number of samples is comparatively higher when compared to other malware distributed through email. Table 1 contains the statistics for 2015 through 2018.
| Year | MyDoom emails | Total emails with malware | % of MyDoom emails | MyDoom samples | Total malware samples | % of MyDoom samples |
| 2015 | 574,674 | 27,599,631 | 2.1% | 87,119 | 615,386 | 14.2% |
| 2016 | 589,107 | 77,575,376 | 0.8% | 142,659 | 960,517 | 14.9% |
| 2017 | 309,978 | 79,599,864 | 0.4% | 95,115 | 340,433 | 27.9% |
| 2018 | 663,212 | 64,919,295 | 1.0% | 150,075 | 528,306 | 28.4% |
Table 1. MyDoom statistics from 2015 through 2018.
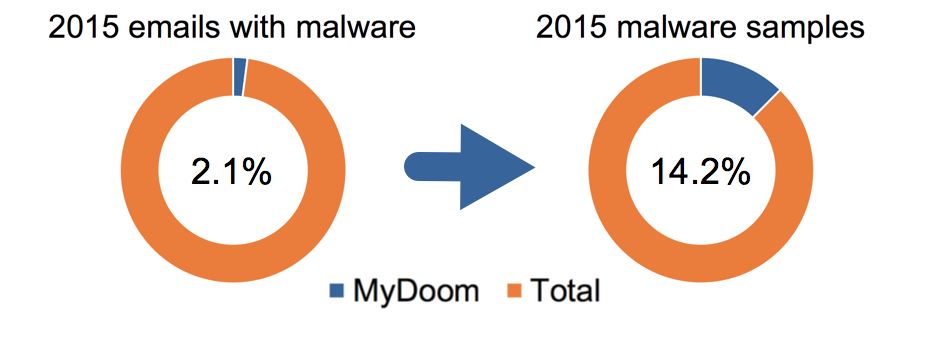 Image 1. MyDoom activity levels in 2015.
 Image 2. MyDoom activity levels in 2016.
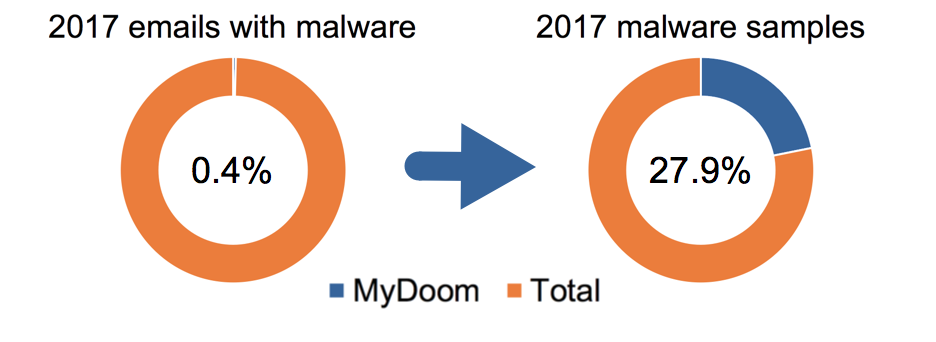 Image 3. MyDoom activity levels in 2017.
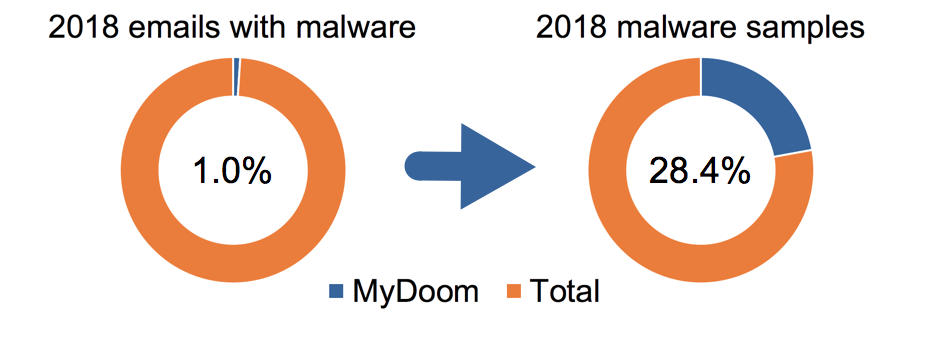 Image 4. MyDoom activity levels in 2018.
MyDoom Activity in 2019
The first six months of 2019 for MyDoom activity reveals a similar average compared to all of 2018, with a slightly higher percentage of both emails and malware samples. See Table 2 for details.
| Year | MyDoom emails | Total emails with malware | % of MyDoom emails | MyDoom samples | Total malware samples | % of MyDoom samples |
| Jan-Jun 2019 | 465,896 | 41,002,585 | 1.1% | 92,932 | 302,820 | 30.1% |
Table 2. MyDoom statistics in the first six months of 2019.
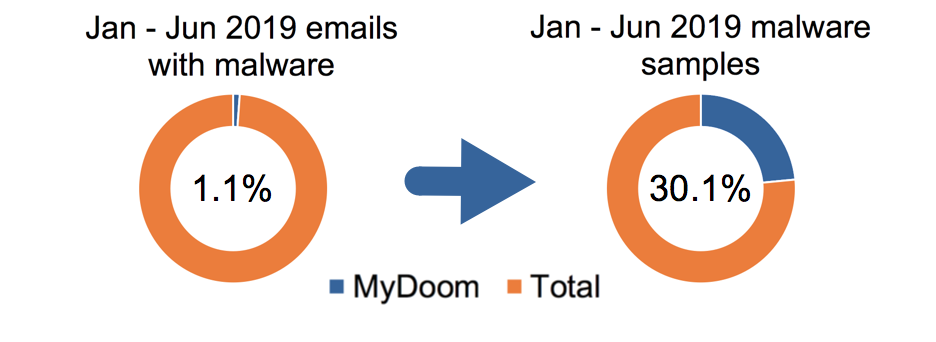 Image 5. MyDoom activity levels in the first six months of 2019.
574 MyDoom samples appeared across more than one month, so the total number of MyDoom malware samples in Table 3 below is different than the total of MyDoom samples in the six-month period taken as a whole in the previous table.
| Month | MyDoom emails | MyDoom malware samples |
| Jan 2019 | 54,371 | 14,441 |
| Feb 2019 | 47,748 | 11,566 |
| Mar 2019 | 80,537 | 18,789 |
| Apr 2019 | 92,049 | 17,278 |
| May 2019 | 113,037 | 15,586 |
| Jun 2019 | 78,154 | 15,846 |
Table 3. MyDoom month to month statistics in the first six months of 2019.
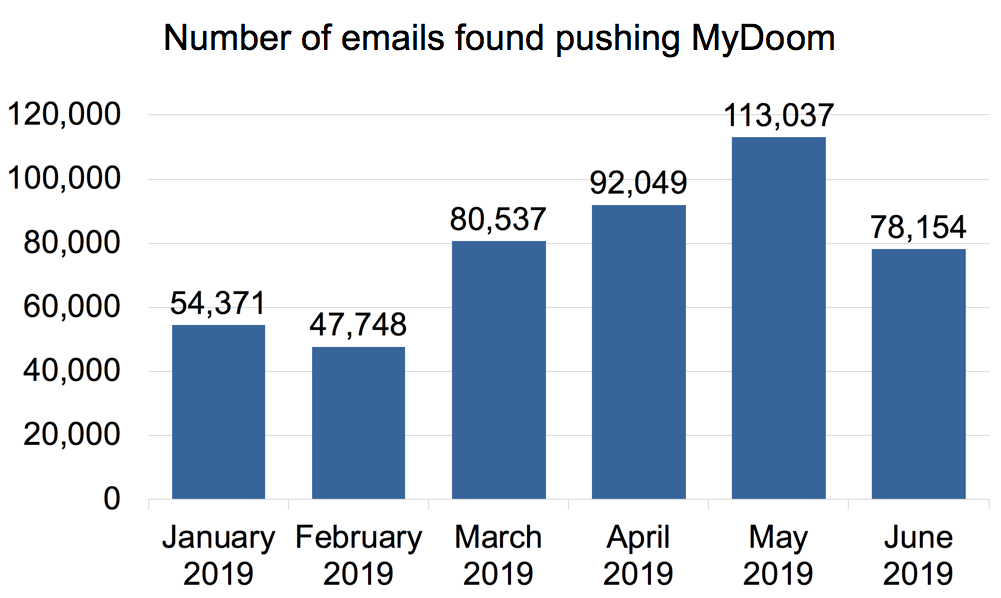 Image 6. Graph charting MyDoom activity from January through June of 2019.
Where have these emails come from? IP addresses of the top ten countries we saw during the first six months of 2019 were:
- China: 349,454 emails
- United States: 18,590 emails
- Great Britain: 10,151 emails
- Vietnam: 4,426 emails
- Republic of Korea (South Korea): 2,575 emails
- Spain: 2,154 emails
- Russia: 1,007 emails
- India: 657 emails
- Taiwan: 536 emails
- Kazakhstan: 388 emails
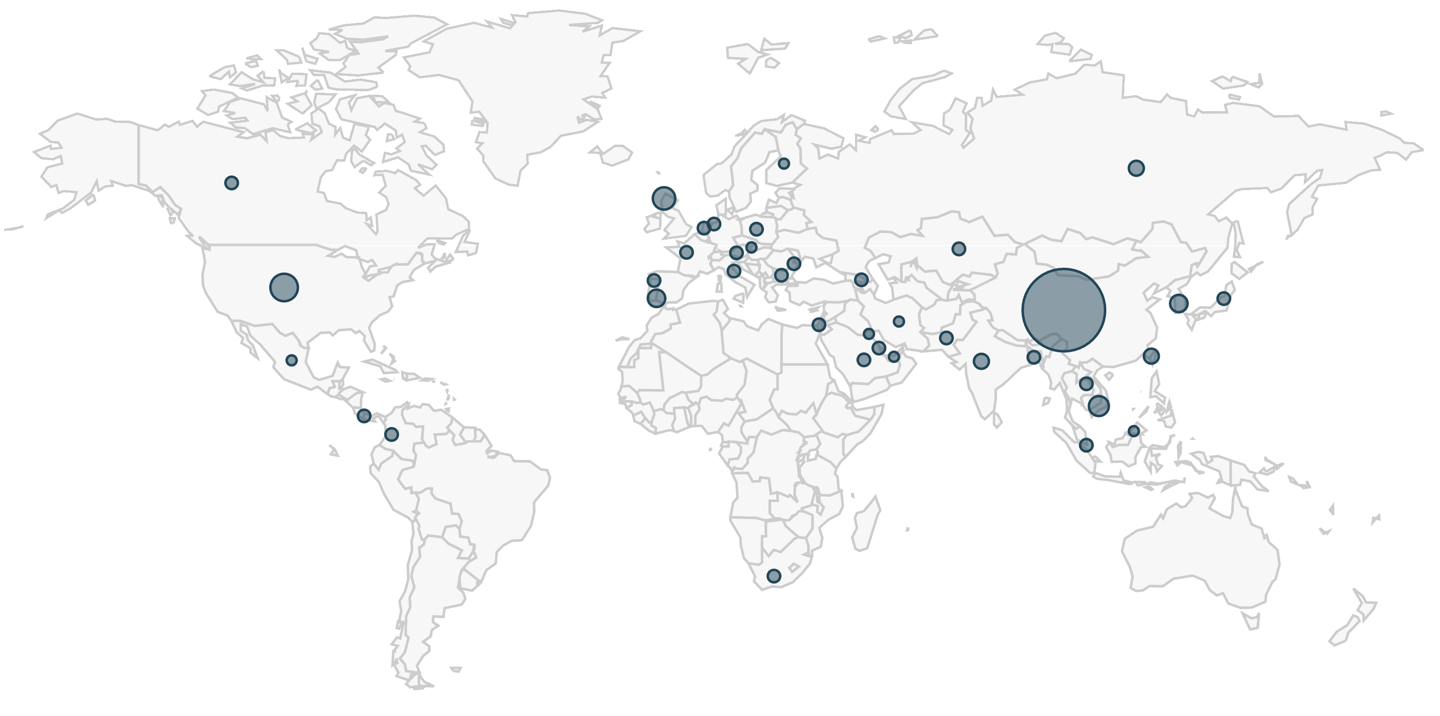 Image 7. Countries that MyDoom emails have appeared from during the first six months of 2019.
Targeted countries were more varied and evenly distributed than the source countries. Top ten targeted countries were:
- China: 72,713 emails
- United States: 56,135 emails
- Taiwan: 5,628 emails
- Germany: 5,503 emails
- Japan: 5,105 emails
- Singapore: 3,097 emails
- Republic of Korea: 1,892 emails
- Romania: 1,651 emails
- Australia: 1,295 emails
- Great Britain: 1,187 emails
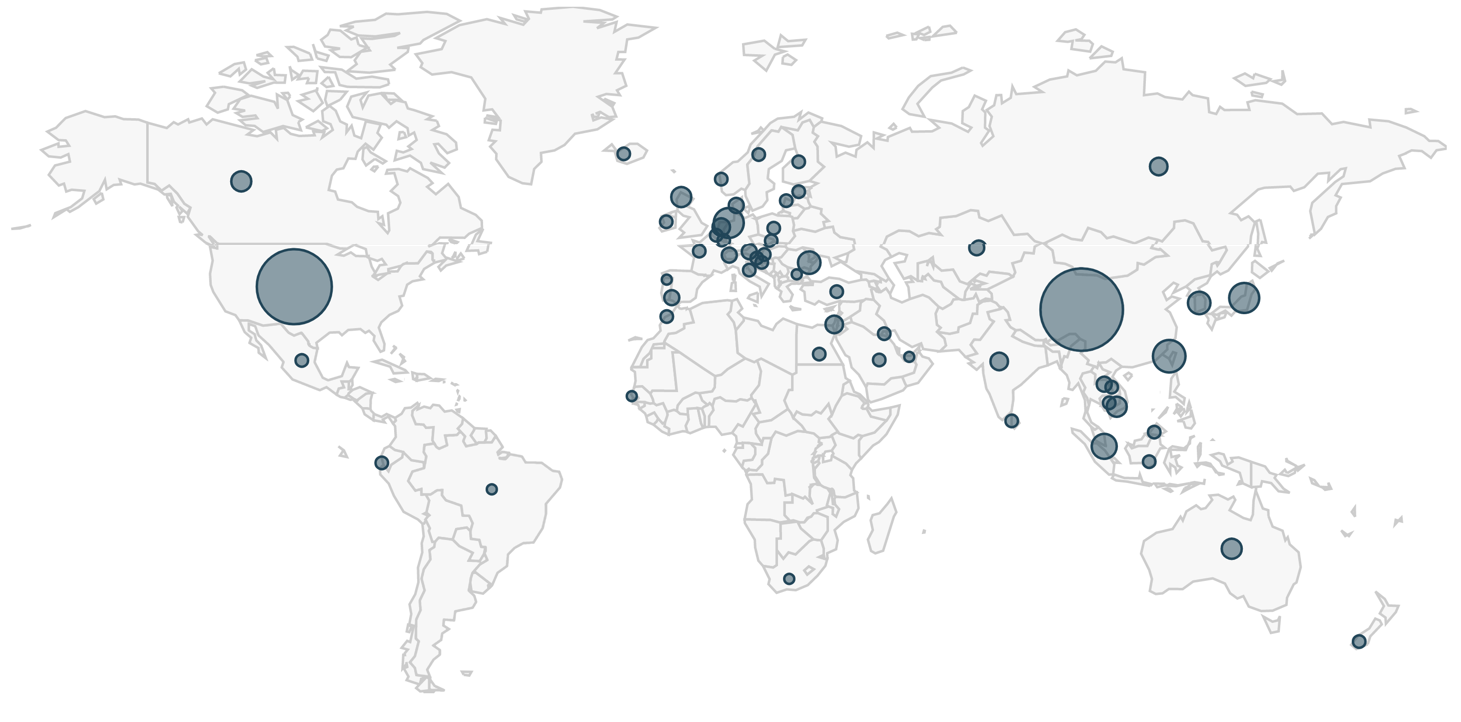 Image 8. Targeted countries of MyDoom emails during the first six months of 2019.
The top ten verticals hit during this period were:
- High Tech: 212,641 emails
- Wholesale and Retail: 84,996 emails
- Healthcare: 49,782 emails
- Education: 37,961 emails
- Manufacturing: 32,429 emails
- Professional and Legal Services: 19,401 emails
- Telecommunications: 4,125 emails
- Finance: 2,259 emails
- Transportation and Logistics: 1,595 emails
- Insurance: 796 emails
These results are skewed likely towards our customer base. However, this data indicates that China and the United States are the source of most MyDoom emails and rank highest as the most targeted countries.
Characteristics of MyDoom
MyDoom distribution has had similar characteristics for years now. In February 2019, Cylance analyzed a sample of MyDoom, and current MyDoom samples follow similar characteristics. Emails distributing MyDoom are generally disguised as reports that an email was not delivered, with subject lines such as:
- Delivery failed
- Delivery reports about your e-mail
- Mail System Error - Returned Mail
- MESSAGE COULD NOT BE DELIVERED
- RETURNED MAIL: DATA FORMAT ERROR
- Returned mail: see transcript for details
However, we also frequently see MyDoom emails with random alphabetic characters in the subject line. MyDoom emails also use other subject lines like:
- Click me baby, one more time
- hello
- Hi
- say helo to my litl friend
Figures 8, 9, and 10 show screenshots of MyDoom email samples from July 2019.
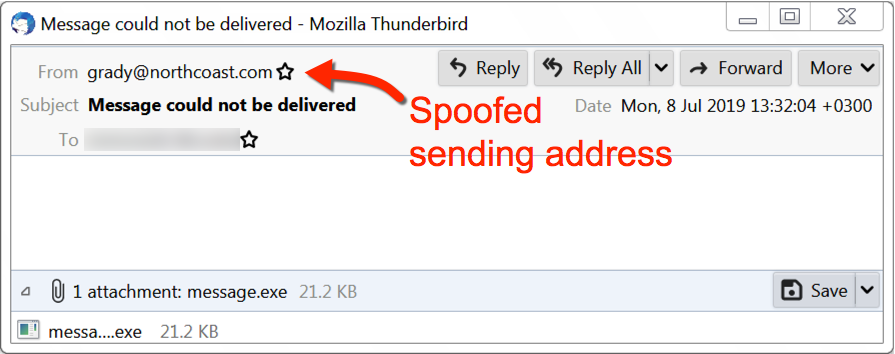 Figure 8. Example of a MyDoom email from July 2019 (1 of 3).
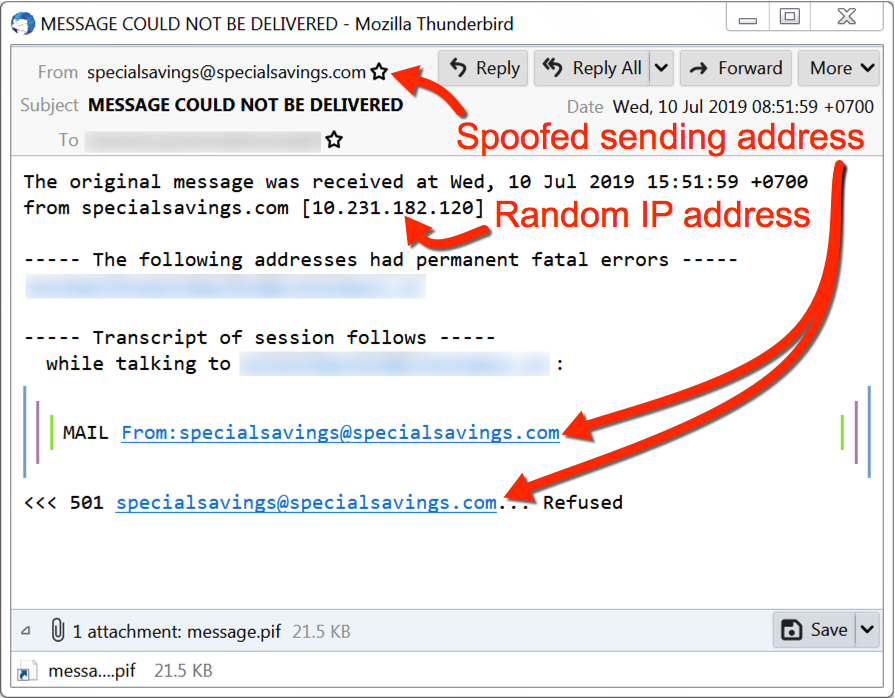 Figure 9. Example of a MyDoom email from July 2019 (2 of 3).
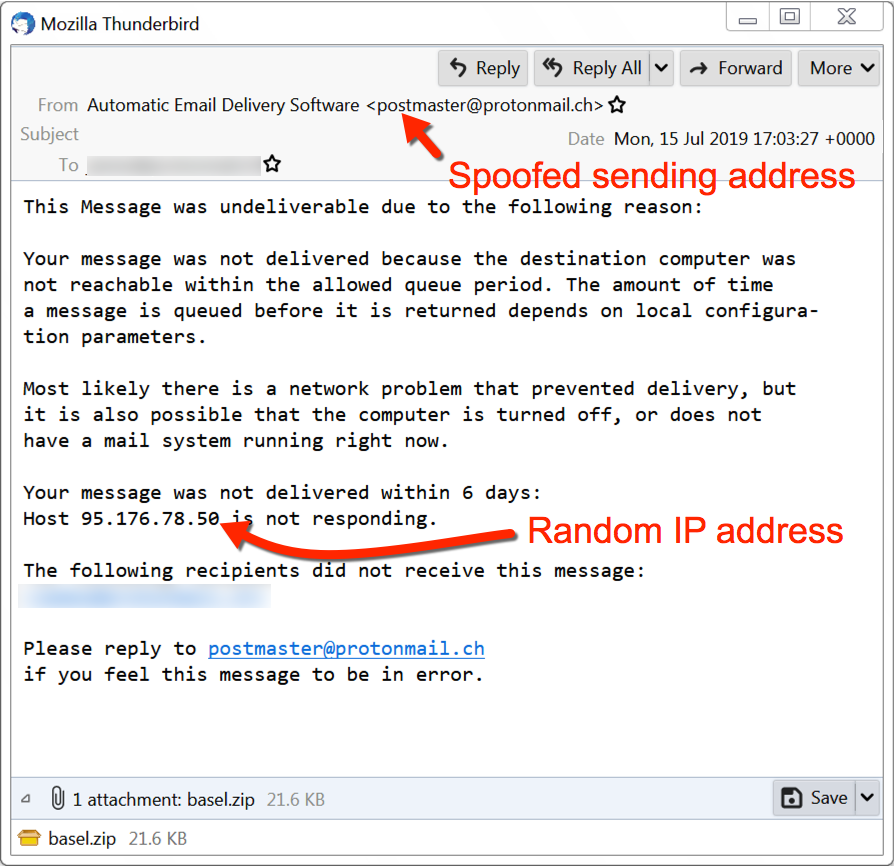 Figure 10. Example of a MyDoom email from July 2019 (3 of 3).
Attachments from these MyDoom emails are executable files, or they are zip archives that contain executable files. MyDoom malware turns an infected Windows host into a malicious spambot, which then sends MyDoom emails to various email addresses. This will happen even if the infected Windows host does not have a mail client. Another characteristic of MyDoom is attempted connections to various IP addresses over TCP port 1042.
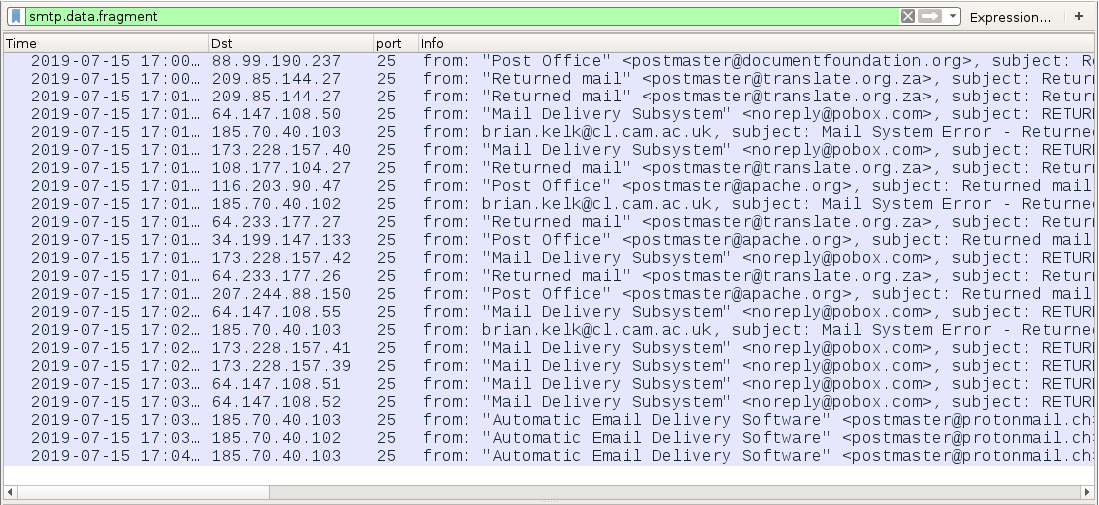 Figure 11. Emails traffic from a host infected with MyDoom on July 15th, 2019.
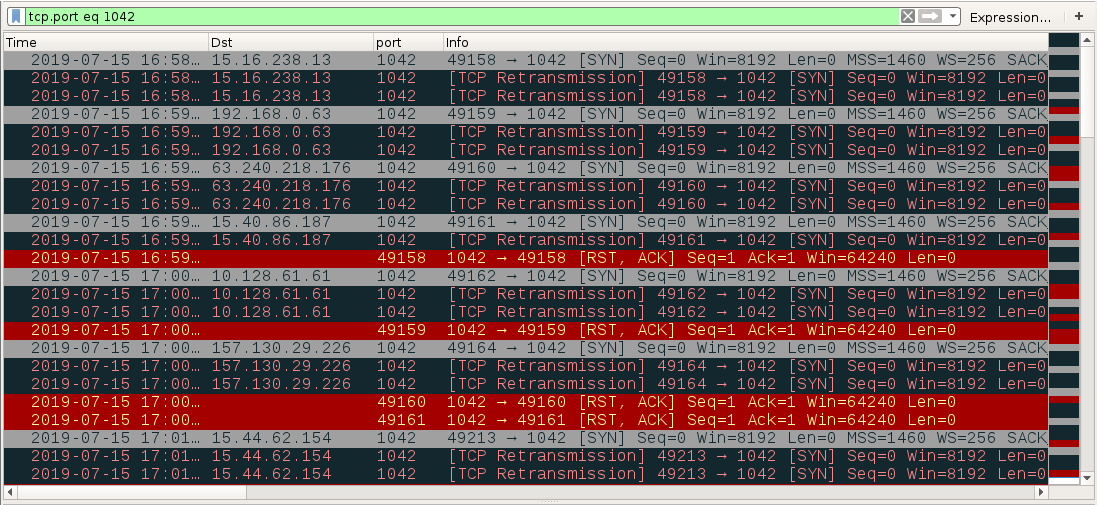 Figure 12. Attempted connections over TCP port 1042 from a host infected with MyDoom.
On a Windows 7 host, MyDoom makes a copy of itself in the user's AppData\Local\Temp directory as lsass.exe, but the malware is not made persistent in the Windows registry. On a Windows XP host, the MyDoom executable makes a copy of itself at C:\Windows\lsass.exe and is made persistent through the Windows registry in the HKEY_LOCAL_MACHINE hive with a key named Traybar at SOFTWARE\Microsoft\Windows\CurrentVersion\Run as shown in Figure 13.
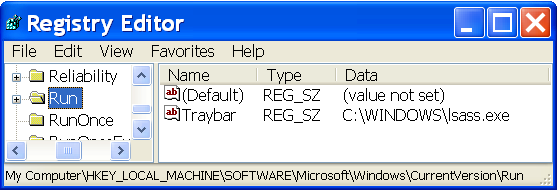 Figure 13. MyDoom persistent on a Windows XP host.
Conclusion
First seen in 2004, MyDoom is still active today-- a testament to its original destructiveness. Enough infrastructure has remained infected throughout the years that we continue to see MyDoom in today's threat landscape. Although a relatively small percentage of malware-based emails contain MyDoom, this malware remains a constant presence.
Based on our data, MyDoom-infected infrastructure resides at IP addresses mostly belonging to China, with the United States running a distant second. Both China and the United States are the primary recipients of MyDoom emails, although the distribution remains global and targets many other countries. High tech is the most frequently targeted industry.
Palo Alto Networks customers are protected from MyDoom by our threat prevention platform which easily detects this malware. AutoFocus users can track MyDoom attempts by using the MyDoom tag.
Palo Alto Networks has shared our findings, including file samples and indicators of compromise, in this report with our fellow Cyber Threat Alliance members. CTA members use this intelligence to rapidly deploy protections to their customers and to systematically disrupt malicious cyber actors. For more information on the Cyber Threat Alliance, visit www.cyberthreatalliance.org.
Indicators of Compromise
MyDoom EXE Samples from July 2019
1b46afe1779e897e6b9f3714e9276ccb7a4cef6865eb6a4172f0dd1ce1a46b42
48cf912217c1b5ef59063c7bdb93b54b9a91bb6920b63a461f8ac7fcff43e205
50dfd9af6953fd1eba41ee694fe26782ad4c2d2294030af2d48efcbcbfe09e11
6a9c46d96f001a1a3cc47d166d6c0aabc26a5cf25610cef51d2b834526c6b596
9e4c6410ab9eda9a3d3cbf23c58215f3bc8d3e66ad55e40b4e30eb785e191bf8
Related Malware Resources

 High Profile Threats


 Threat Actor Groups