
Executive Summary
We created an in-depth malware analysis tutorial featuring shellcode generated by a tool named Donut. The tutorial walks through a single infection chain from end to end, starting with a sample, and assuming no prior knowledge of the malware in question.
By the end of the tutorial, readers will better understand many components of the infection chain and identify the family of the final payload. The tutorial is designed to be a beginner-friendly lesson for those who understand the basics of malware analysis but have yet to analyze many samples in the wild on their own.
With the help of this tutorial, we hope that readers will:
- Become familiar with common malware analysis tools like dnSpy, IDA Pro, x64dbg and ProcessHacker
- Learn how to leverage both static and dynamic analysis to form a complete picture of malware behavior
- Recognize common techniques used by malware in its natural context, such as:
- Dynamic API resolution
- Process injection
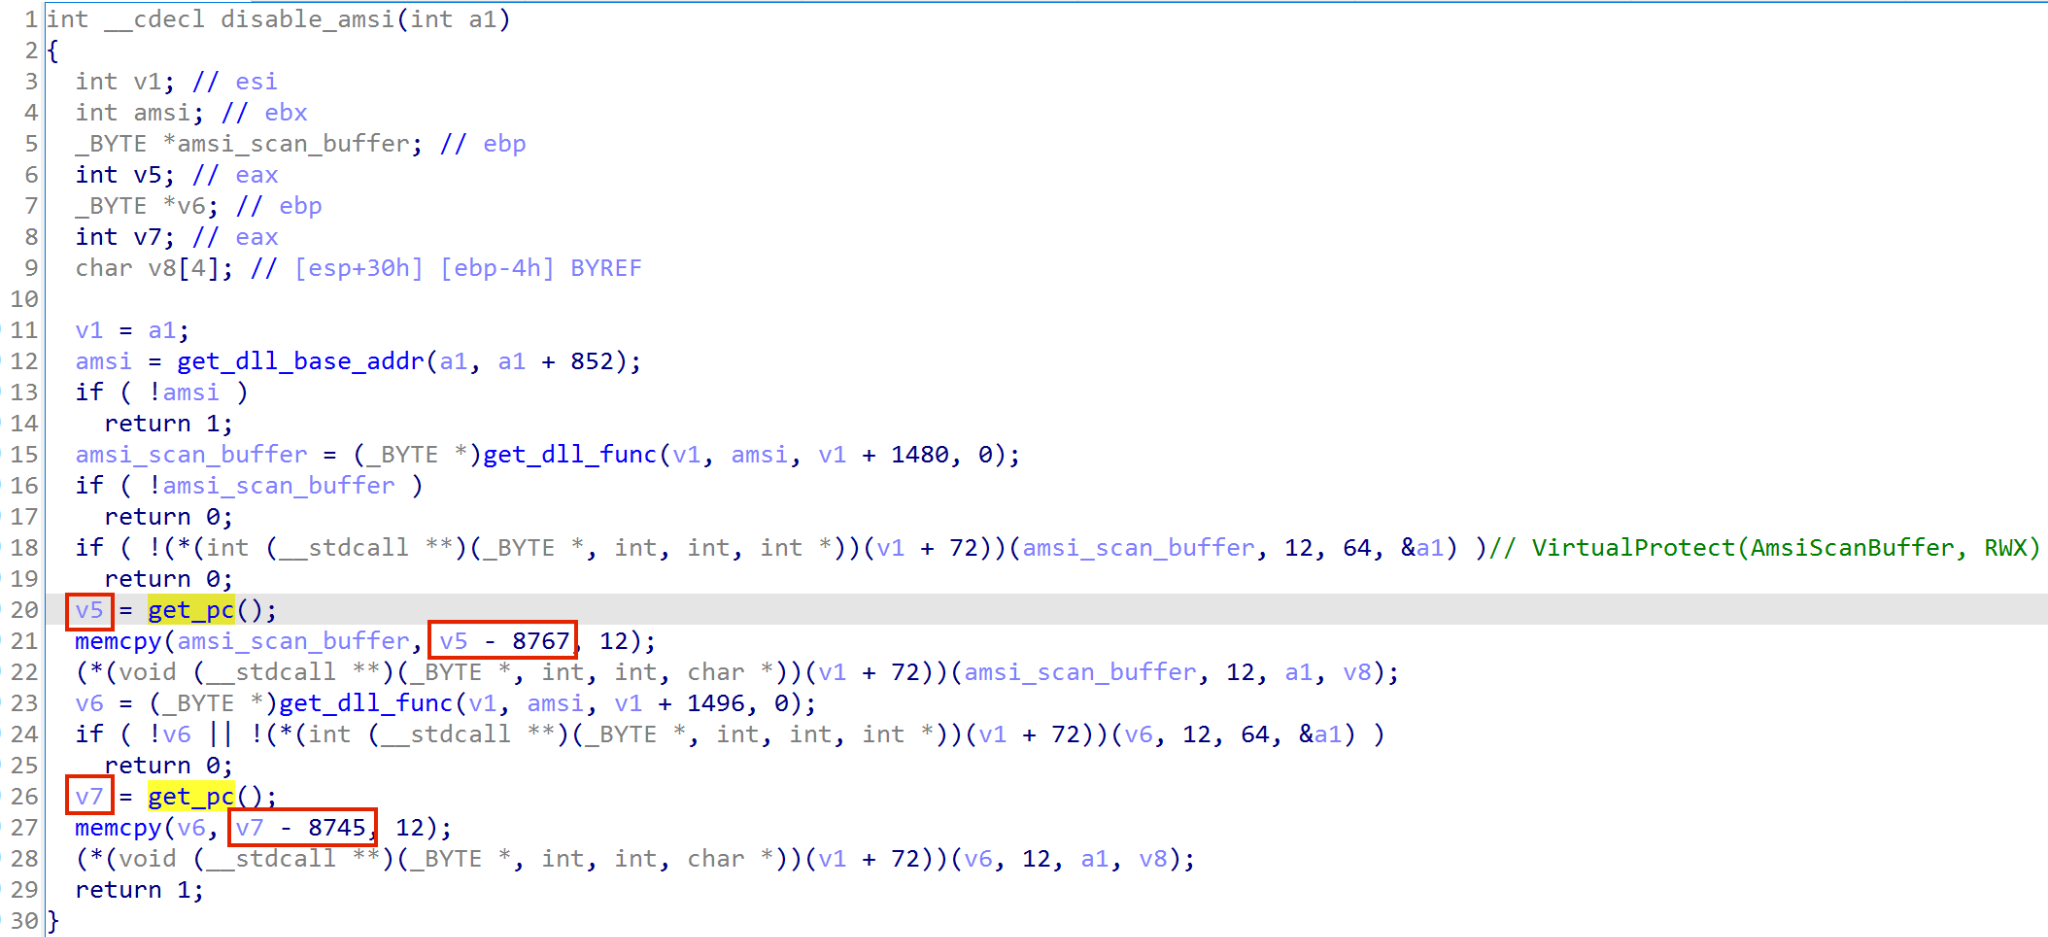
- Bypassing AMSI by using memory patching
- Gain insight on how malware analysts at Palo Alto Networks might approach an unknown sample in their daily operations
The infection chain in this tutorial is composed of different stages, each playing a different role. These stages include downloading the initial malware, hiding traces of malicious activity and dropping the final payload.
Along the way, we record every step in our analysis, and we explain our thought process behind each decision. We explain not only what the malware sample is doing, but also the reasons why a malware sample might do the observed activity.
Due to the large size of the tutorial, we have included a small excerpt in this article as a preview. To read the tutorial in its entirety, please view it on our GitHub page.
Palo Alto Networks customers are better protected from the malware reviewed in this tutorial through the following products and services:
- Cortex XDR and XSIAM
- Our Next-Generation Firewall with Cloud-Delivered Security Services, including
If you think you might have been compromised or have an urgent matter, contact the Unit 42 Incident Response team.
| Related Unit 42 Topics | Shellcode, Static Analysis |
Excerpt of Donut Malware Analysis Tutorial
This excerpt features the analysis of an unknown function in the Donut-generated shellcode used during the attack chain. The analysis helps explain some basic techniques using IDA Pro as a disassembler and decompiler and x64dbg as a debugger.
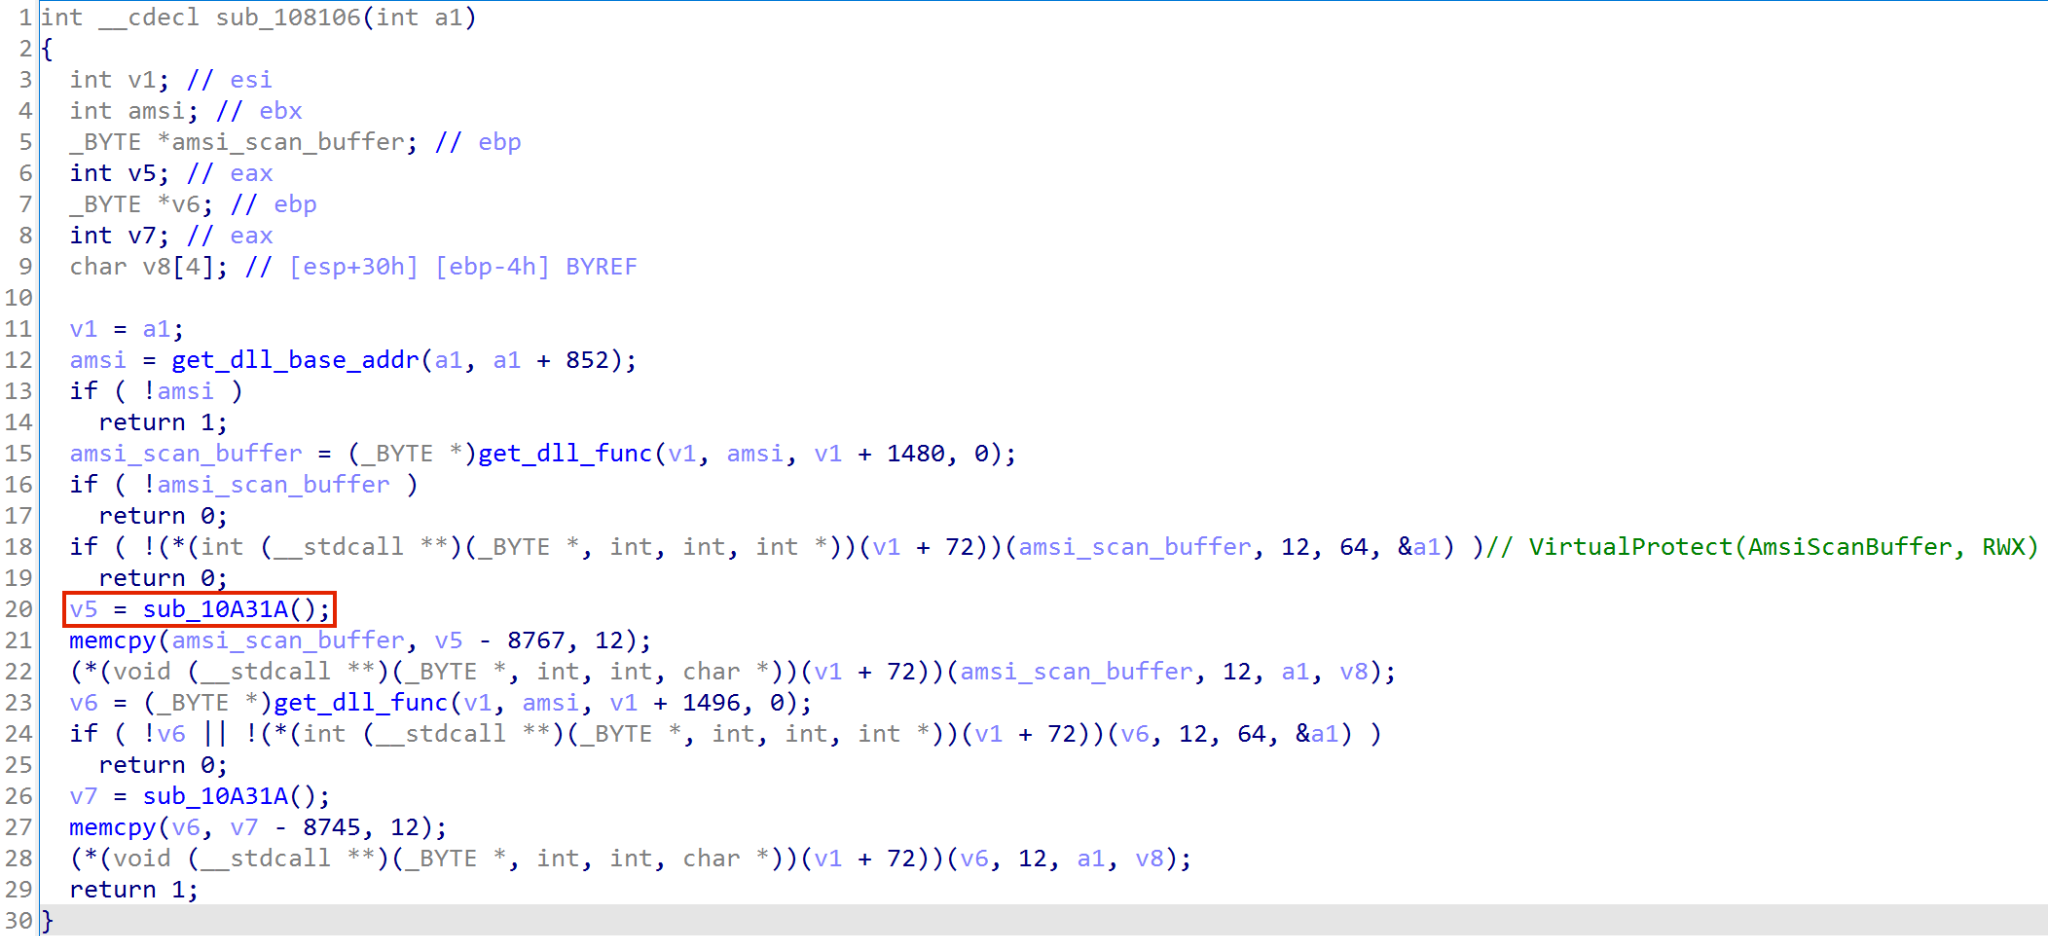
The screenshot below shows the decompiled shellcode in IDA Pro. The unknown function is sub_10A31A, highlighted in a red box in Figure 1. This unknown function does not take any arguments.
Using x64dbg as a debugger for this shellcode, we can view the content of the EAX register from the sub_10A31A function. The EAX register merely returns the address of the function, which is 06CDA31 as Figure 2 shows.

Figure 3 below shows the decompiled code of the sub_10A31A function.
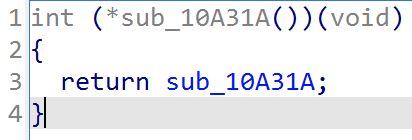
This function is extremely simple because it just returns the address of the function, so it matches what we just observed in x64dbg. But what is the purpose of returning the address of the function? Let’s return to the debugger to find some clues.
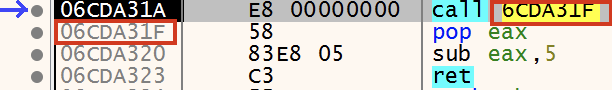
Stepping through the shellcode in x64dbg, the Extended Instruction Pointer (EIP) is on the first instruction, call 6CDA31A as shown below in Figure 4. The operand of the call instruction, 6CDA31A, is the address of the sub_10A31A function.
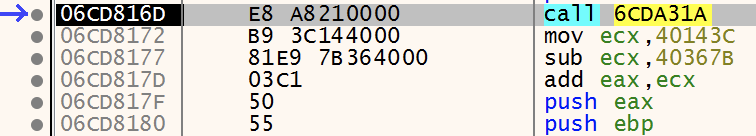
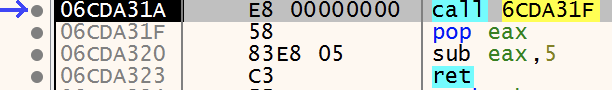
This function calls the instructions starting at 0x06CDA31A. Figure 5 below shows these instructions.
We can find the same instructions for this function by viewing the shellcode in IDA. However, IDA shows the same instruction as call $+5 in the disassembled code as Figure 6 below shows, in the red box.
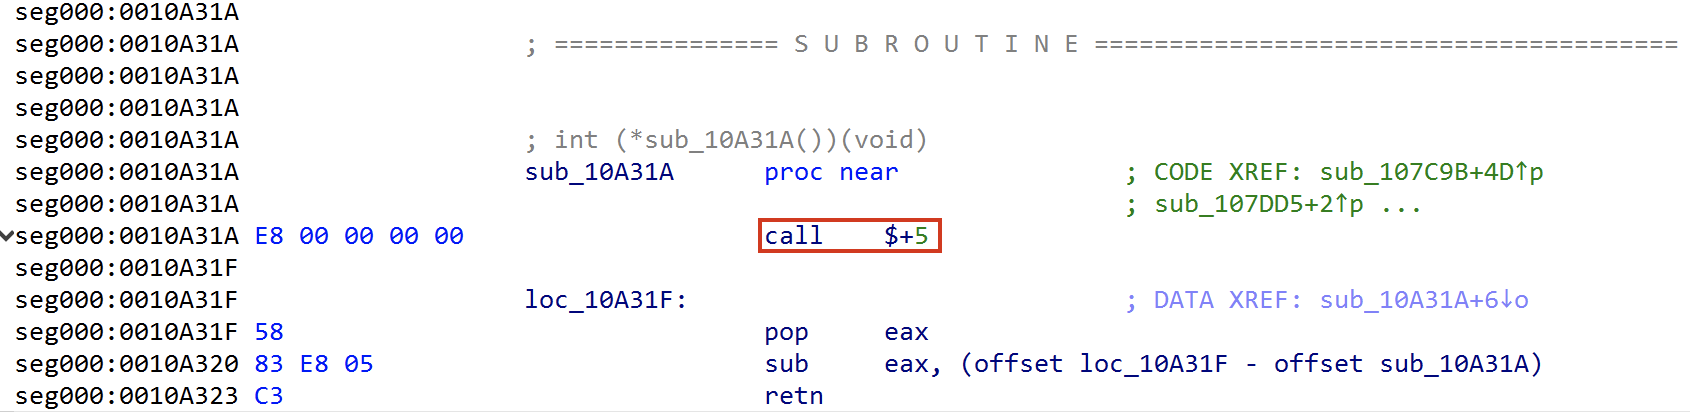
Let’s break down the call $+5 instruction shown in IDA:
- $+5 just means “the current address (EIP) plus 5.” With a value of E8 00 00 00 00, the full call instruction is 5 bytes, so $+5 effectively refers to the instruction immediately after the call instruction (i.e., the address of the pop eax instruction).
- call pushes the return address (i.e., the address right after the call instruction) onto the stack and jumps to the operand of the call instruction.
Putting these two facts together, call $+5 means “push the address immediately after the call instruction onto the stack and then jump to that address.”
This might seem like a very roundabout way of pushing the address of the next instruction onto the stack, but the x86 instruction set does not provide a more straightforward way of doing so. An instruction like push eip+5 is not valid, as EIP cannot be used directly as an operand.
Let’s turn our attention back to the debugger to observe this in action. The instruction call 6CDA31F pushes 0x06CDA31F onto the stack and then jumps to 0x6CDA31F as shown in Figure 7.
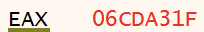
Now that 0x06CDA31F is on the stack, it gets stored in the EAX register with the pop eax instruction as shown in Figure 8.
And then we subtract 5 from 0x06CDA31F with the sub eax, 5 instruction as shown in Figure 9.
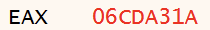
As we observed when we first stepped over sub_10A31A, the result is that 0x06CDA31A gets stored in EAX.
The sequence of instructions inside sub_10A31A is commonly used to implement PC-relative addressing and allows the shellcode to be position-independent. Why is this important? Just like any program, malware may have some resources that it needs to access.
Resources can be accessed via absolute addresses or an offset relative to a base address. Regular PE files can access resources using absolute addresses because the PE loader applies relocation adjustments if the program is loaded into a memory region different from its preferred base address. However, shellcode doesn’t have this capability and thus must rely on relative addresses.
By calling sub_10A31A, the shellcode can access the resources it needs by using an offset relative to the address of sub_10A31A in memory. We can then look at the decompiled code in Figure 10 to see how it’s used. The address returned by sub_10A31A (which we’ll now call get_pc) is used in the second argument of memcpy to access the address of the source buffer.
Conclusion
Analyzing malware is a very detailed and complex process. Through the full tutorial, we hope to help others improve their skills in malware analysis through a step-by-step analysis of an infection chain.
If you found this excerpt interesting, please read the full tutorial. Happy analyzing!
Palo Alto Networks customers are better protected from the shellcode discussed in this article through the following products:
- The Advanced WildFire machine-learning models and analysis techniques have been reviewed and updated in light of the indicators shared in this research.
- Advanced URL Filtering and Advanced DNS Security identify known domains and URLs associated with this activity as malicious.
- Cortex XDR and XSIAM are designed to prevent the execution of known malicious malware, and also prevent the execution of unknown malware using Behavioral Threat Protection and machine learning based on the Local Analysis module.
If you think you may have been compromised or have an urgent matter, get in touch with the Unit 42 Incident Response team or call:
- North America: Toll Free: +1 (866) 486-4842 (866.4.UNIT42)
- UK: +44.20.3743.3660
- Europe and Middle East: +31.20.299.3130
- Asia: +65.6983.8730
- Japan: +81.50.1790.0200
- Australia: +61.2.4062.7950
- India: 00080005045107
Palo Alto Networks has shared these findings with our fellow Cyber Threat Alliance (CTA) members. CTA members use this intelligence to rapidly deploy protections to their customers and to systematically disrupt malicious cyber actors. Learn more about the Cyber Threat Alliance.
Indicators of Compromise
- SHA256 hash: d2bea59a4fc304fa0249321ccc0667f595f0cfac64fd0d7ac09b297465cda0c4
- File size: 1,092,149 bytes
- File type: Data
- File description: Decrypted Donut-generated shellcode
Additional Resources
- Donut - Injecting .NET Assemblies as Shellcode – The Wover
- Analysis of Native Process CLR Hosting Used by AgentTesla – SonicWall
- Bypassing Enterprise EDR to Inject .NET Assemblies Into Remote Processes – MacoSec
Table of Contents
Related Malware Resources
 High Profile Threats

 Threat Actor Groups