
Executive Summary
Gartner anticipates the number of Internet of Things (IoT) and Internet of Medical Things (IoMT) devices will reach 25 billion by 2021. These connected devices will generate and collect Global Positioning System (GPS) data from personal health to smart cities. In this blog, we use the open-source tool Kepler to demonstrate the use cases of GPS data -- how to track location, movement, velocity and altitude from single or multiple devices. In the right circumstances, we could track a person not just to a physical location but also determine if this individual was in a car or an aircraft, and for how long.
GPS is invaluable to an IoT or an IoMT device because it can indicate location, altitude, speed, time, and direction. For example, IoMT devices can be used to monitor users’ health conditions, such as body temperature, heart rate, movements, and other medical information. In an emergency, using the interconnected GPS data, an IoMT device can not only alert first responders but also relay critical location data. Similarly, interconnected data can be used by law enforcement and investigators to deep dive into criminal behaviors and physical safety concerns.
The value of GPS coordinates has also attracted attackers' attention. Security researchers have seen malware like Exodus collect GPS data from infected mobile devices. It goes without saying the data privacy and data security concerns of GPS data cannot be overlooked. The reality is that more and more devices will produce more and more data as IoT adoption continues to accelerate.
Before IoT, There Were Mobile Phones
The GPS project was launched in the United States in 1973. The goal was to use four or more satellites to track geolocation data and time information on objects on Earth. IoT may be a new frontier, but we can learn quite a bit from experiences with mobile phones, the data they and their apps collect, and techniques for analyzing this data while avoiding its pitfalls.
These are not hypothetical questions. COVID-19 has led to numerous countries using or discussing the use of GPS and other location data from mobile phones to help track patients, potential new patients, etc. All of these use-cases beg the question: what other conclusions can we draw from GPS data? How else can we use and understand it in a variety of situations?
For the sake of simplicity, we will narrow the scope of our analysis to data provided by using Google’s Takeout functionality for a Pixel mobile phone. The data produced by this device, and enriched by Google, is a good example of basic GPS data, telematics data, and a glimpse into how IoT devices tie into GPS data.
First, what’s in the data? Basic GPS information includes latitude, longitude, and a timestamp. What many people don’t realize is that GPS can usually provide a measure of altitude above sea level as well, and horizontal and vertical measures of accuracy. GPS data can also measure speed at a single point in time by measuring the Doppler shift of a device compared to GPS satellites.
More interestingly for this use case, Google also provides predictions of what a user was doing and assigns them probabilities (e.g. ON_FOOT 85%, STILL 10%, etc.). This may not be the bleeding edge of IoT data, but it gives us a solid framework to understand how easily other types of IoT data and GPS data can flow together. Say we were to replace these predictions with a different source of data -- heart monitors, wheelchairs, defibrillators and oxygen pumps -- and instead of predicting whether someone was sitting or standing, we predicted if their vital signs showed indications of stress or heartbeat irregularities. Instead of examining where a person most likely to sit or walk, we could just as easily tie predictions from these IoT sensors to GPS data.
Data Preparation
There is always a bit of data preparation that goes into any analysis. In general, as long as analysts are able to get their data into a table format, they should be able to upload and use their data in most tools. An example table would have something like the following headers, and each row would be a “ping,” or single GPS record. The red fields are “core” GPS fields that would be expected on any device gathering GPS data. The yellow fields such as accuracy, altitude, and velocity are generally included as well, but not always. The blue fields are from Google’s activity classification engine that uses multiple sensors in the device to predict what the user is doing and assign a confidence interval to that prediction[1]. This prediction is a rough proxy for how an IoT device could marry its data to GPS data.
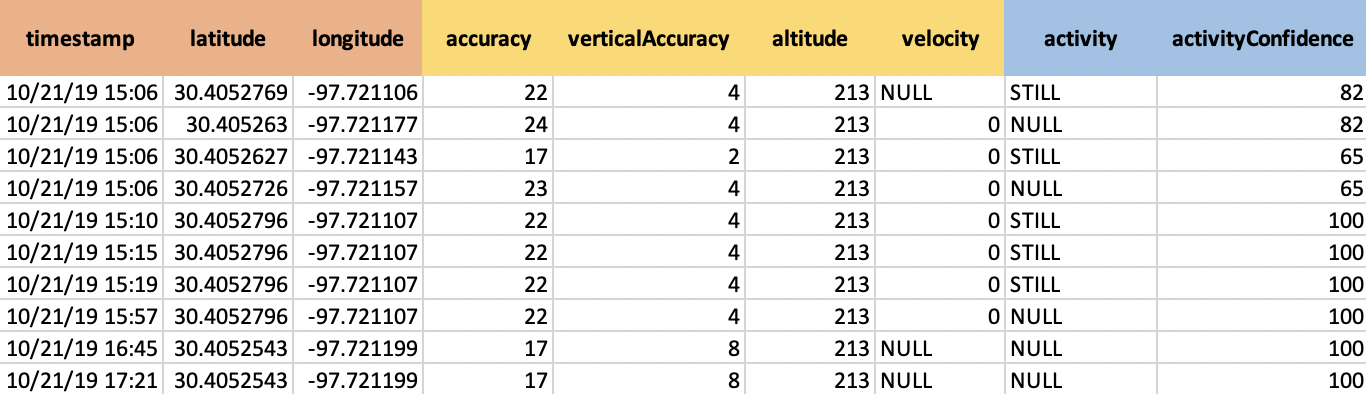
Table 1. Example of Android data from Google Takeout
Location and Movement: One Mobile Device
Figure 1 shows the approximate times that someone was at a location and their velocities while arriving and leaving. Red means lower speed and green means faster speeds (measured in meters/second). All times are in UTC, and it looks like this individual spent about 10 hours at the solid red dot in the middle of the animation. The opacity of the points is very low. Meaning that a single point will be fairly light, but a point where a mobile device spends more time will be darker. This effect can be seen as the red dot where the user stopped becomes more opaque over the 10 hours spent there. They then left the location on a different path than they originally took to arrive there, and they were going faster when leaving as well. You may notice that there appear to be gaps in GPS points between locations. This may be entirely normal, depending on numerous factors like device, app, weather, surrounding buildings, etc.
Zooming in on the location where the individual stopped, we can see more detail. In this animation, only the outlines of points are shown so that it is easier to determine when a new data point appears on the graph. The color of the points corresponds to velocity with red being slow and green being fast. Not surprisingly, at an office building, all the pings are red. The radii of the points match the horizontal accuracy of the GPS point in meters, and is scaled to the map. Given the high degree of overlap for these points, and the level of accuracy, it is reasonable to infer that the individual spent a good amount of their time on the north end of the building in question.
Location and Movement: Multiple Mobile Devices
Can we determine if two mobile devices were at the same location at the same time? In order to answer this question, we generated two sets of data for two separate mobile devices, let’s name them Sally and Bob. Then we’ll follow roughly the same analysis that we did for one mobile device.
In Figure 3, at around 14:10 UTC, we see points for Sally start to appear on location in blue. At 15:06, points for Bob (in red) appear at the location and continue appearing until 21:00. From 21:02 - 21:06, Bob appears to be outside the location and moving away from it. Sally is still on location at 21:12. This leads us to the conclusion that Bob and Sally were in approximately the same location from around 15:06 until 21:00. It’s also worth noting that the horizontal accuracy of Bob’s location decreases greatly on his last ping (the large red circle). This is fairly common in areas where receiving GPS signals is difficult, but it still appears that he continued his path of walking away from the building.
Velocity and Altitude
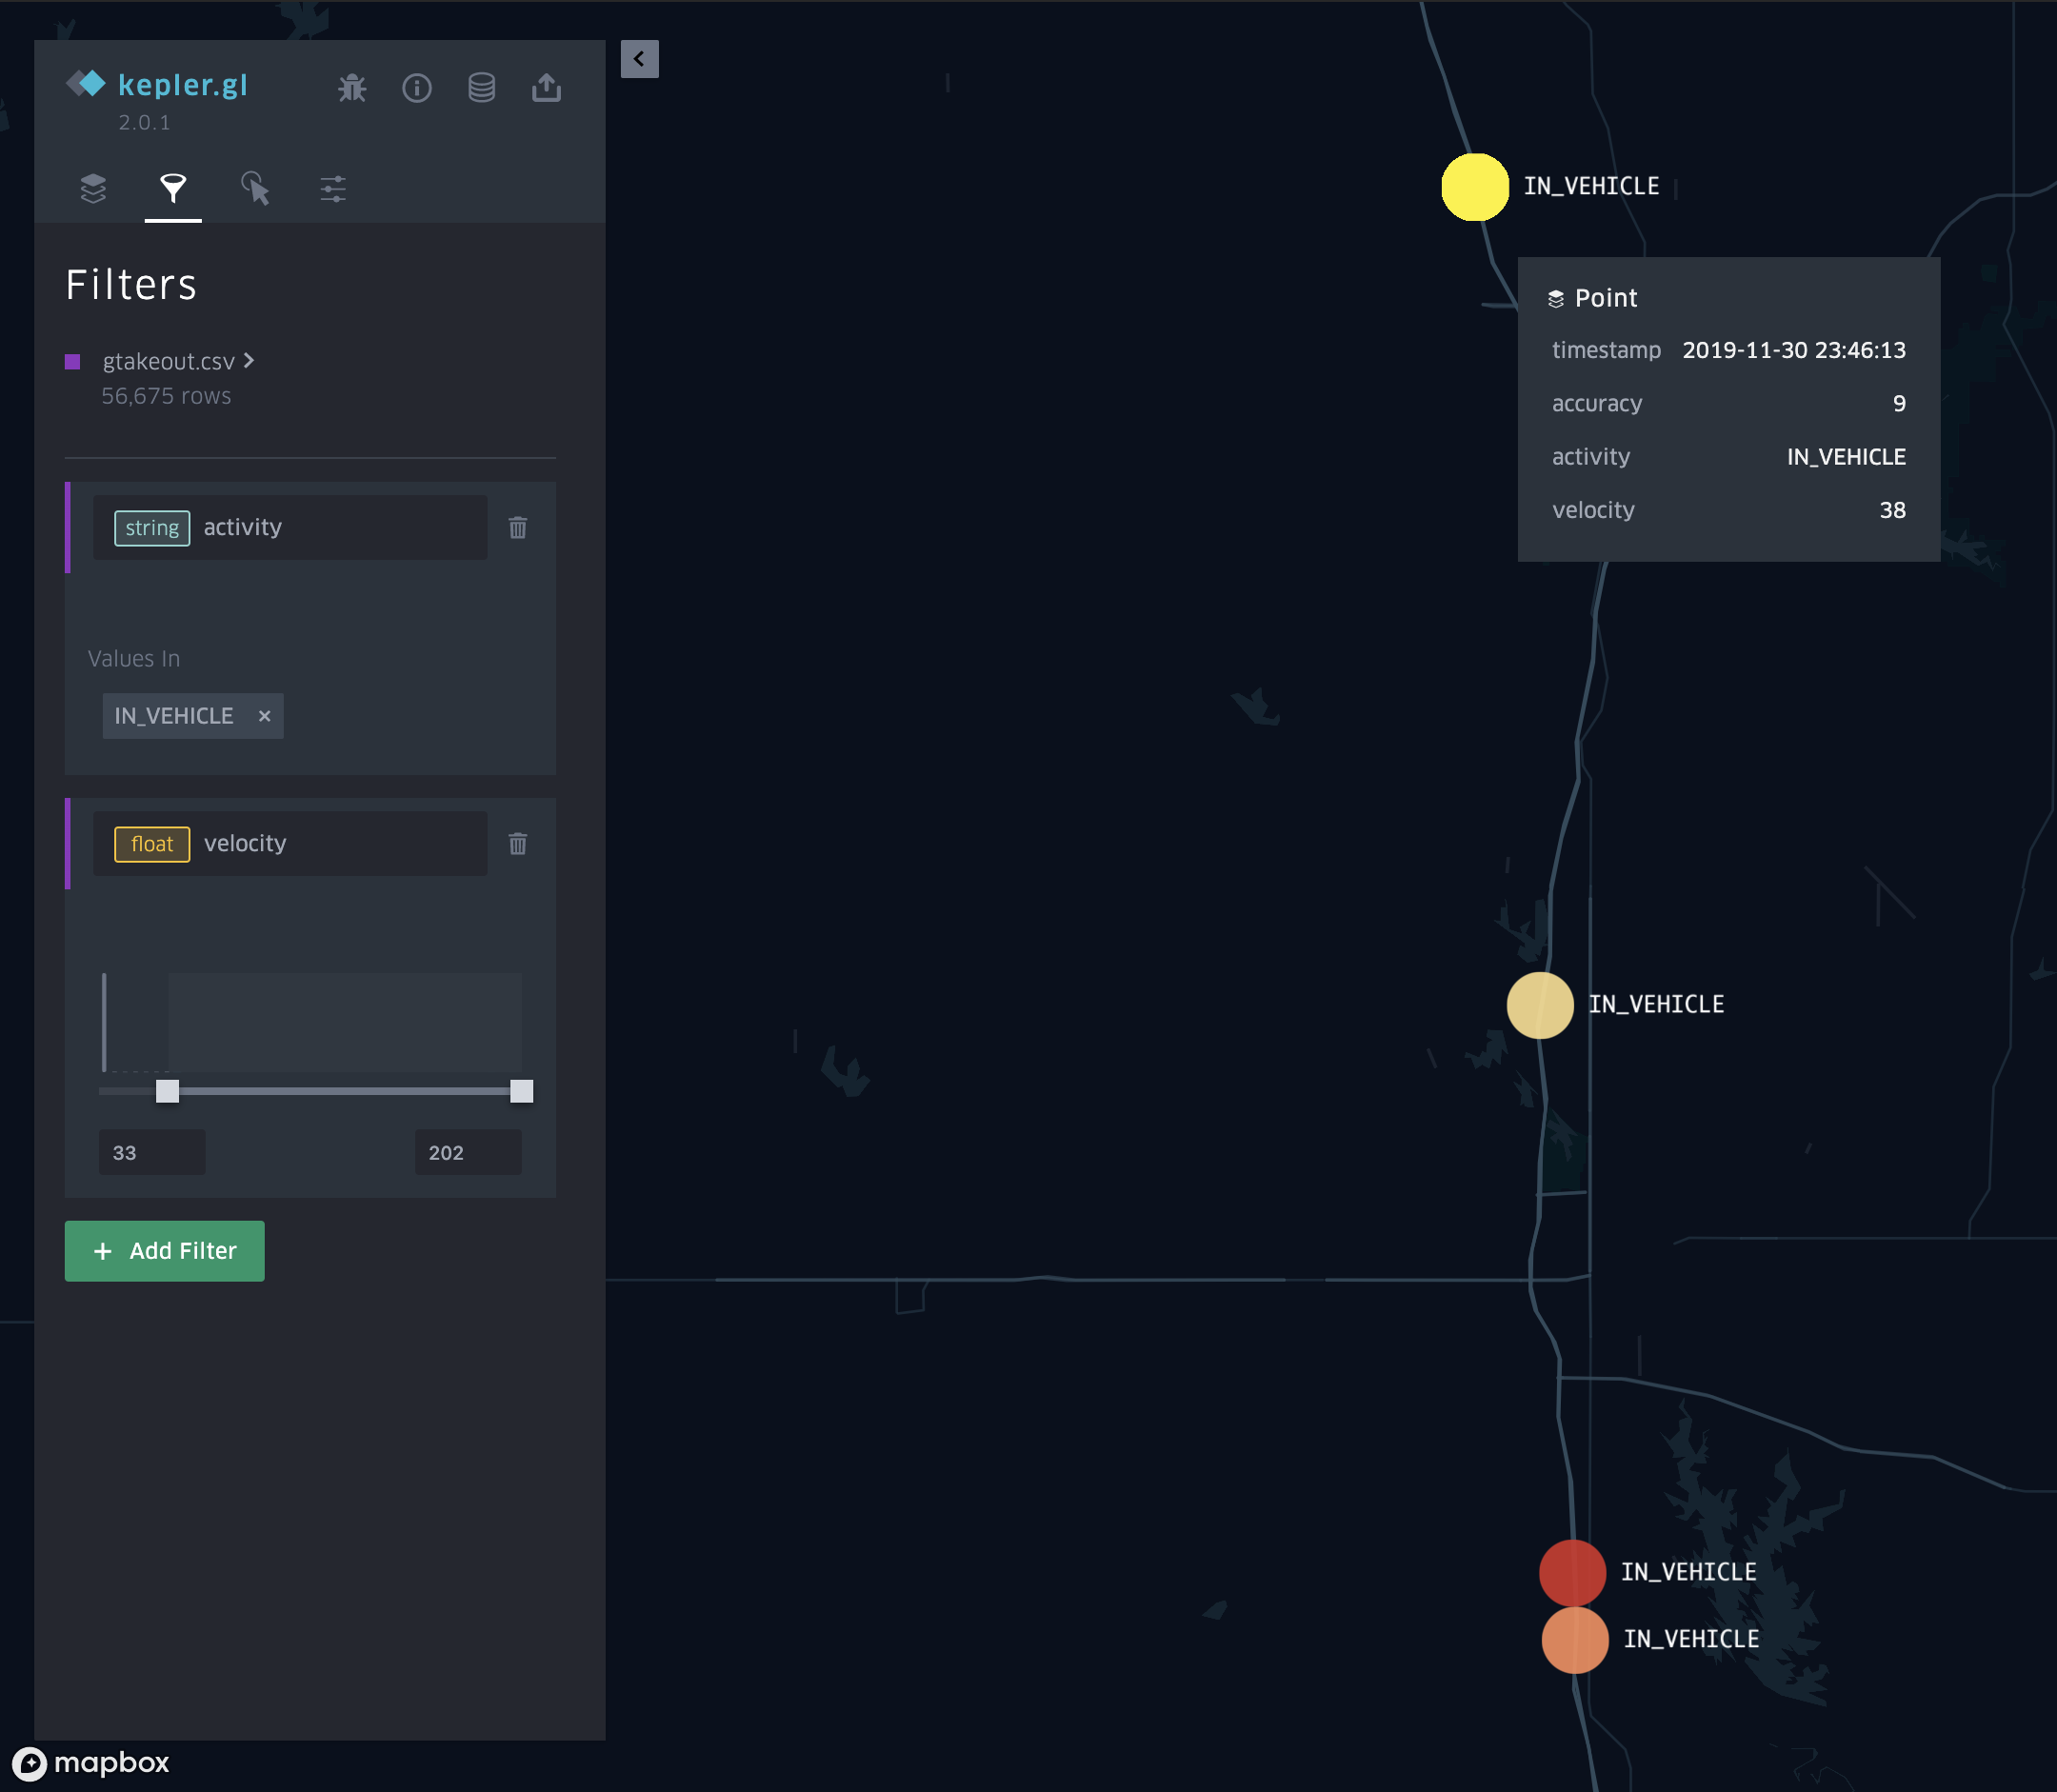
If we wanted to filter to just data points from a mobile device in a moving vehicle and going perhaps too fast? We can use Google’s activity classification and velocity as filters. This is where IoT data can merge nicely with GPS. In this case, we are using the combination of the two to find a mobile device that was likely in a speeding car. In Figure 4, we see four points on what appears to be a highway with speeds ranging up to 85 mph (the graph is in m/s):
What’s also interesting is another point captured by this filter. Except this one is going about 450 mph at about 35,000 feet altitude in Figure 5:
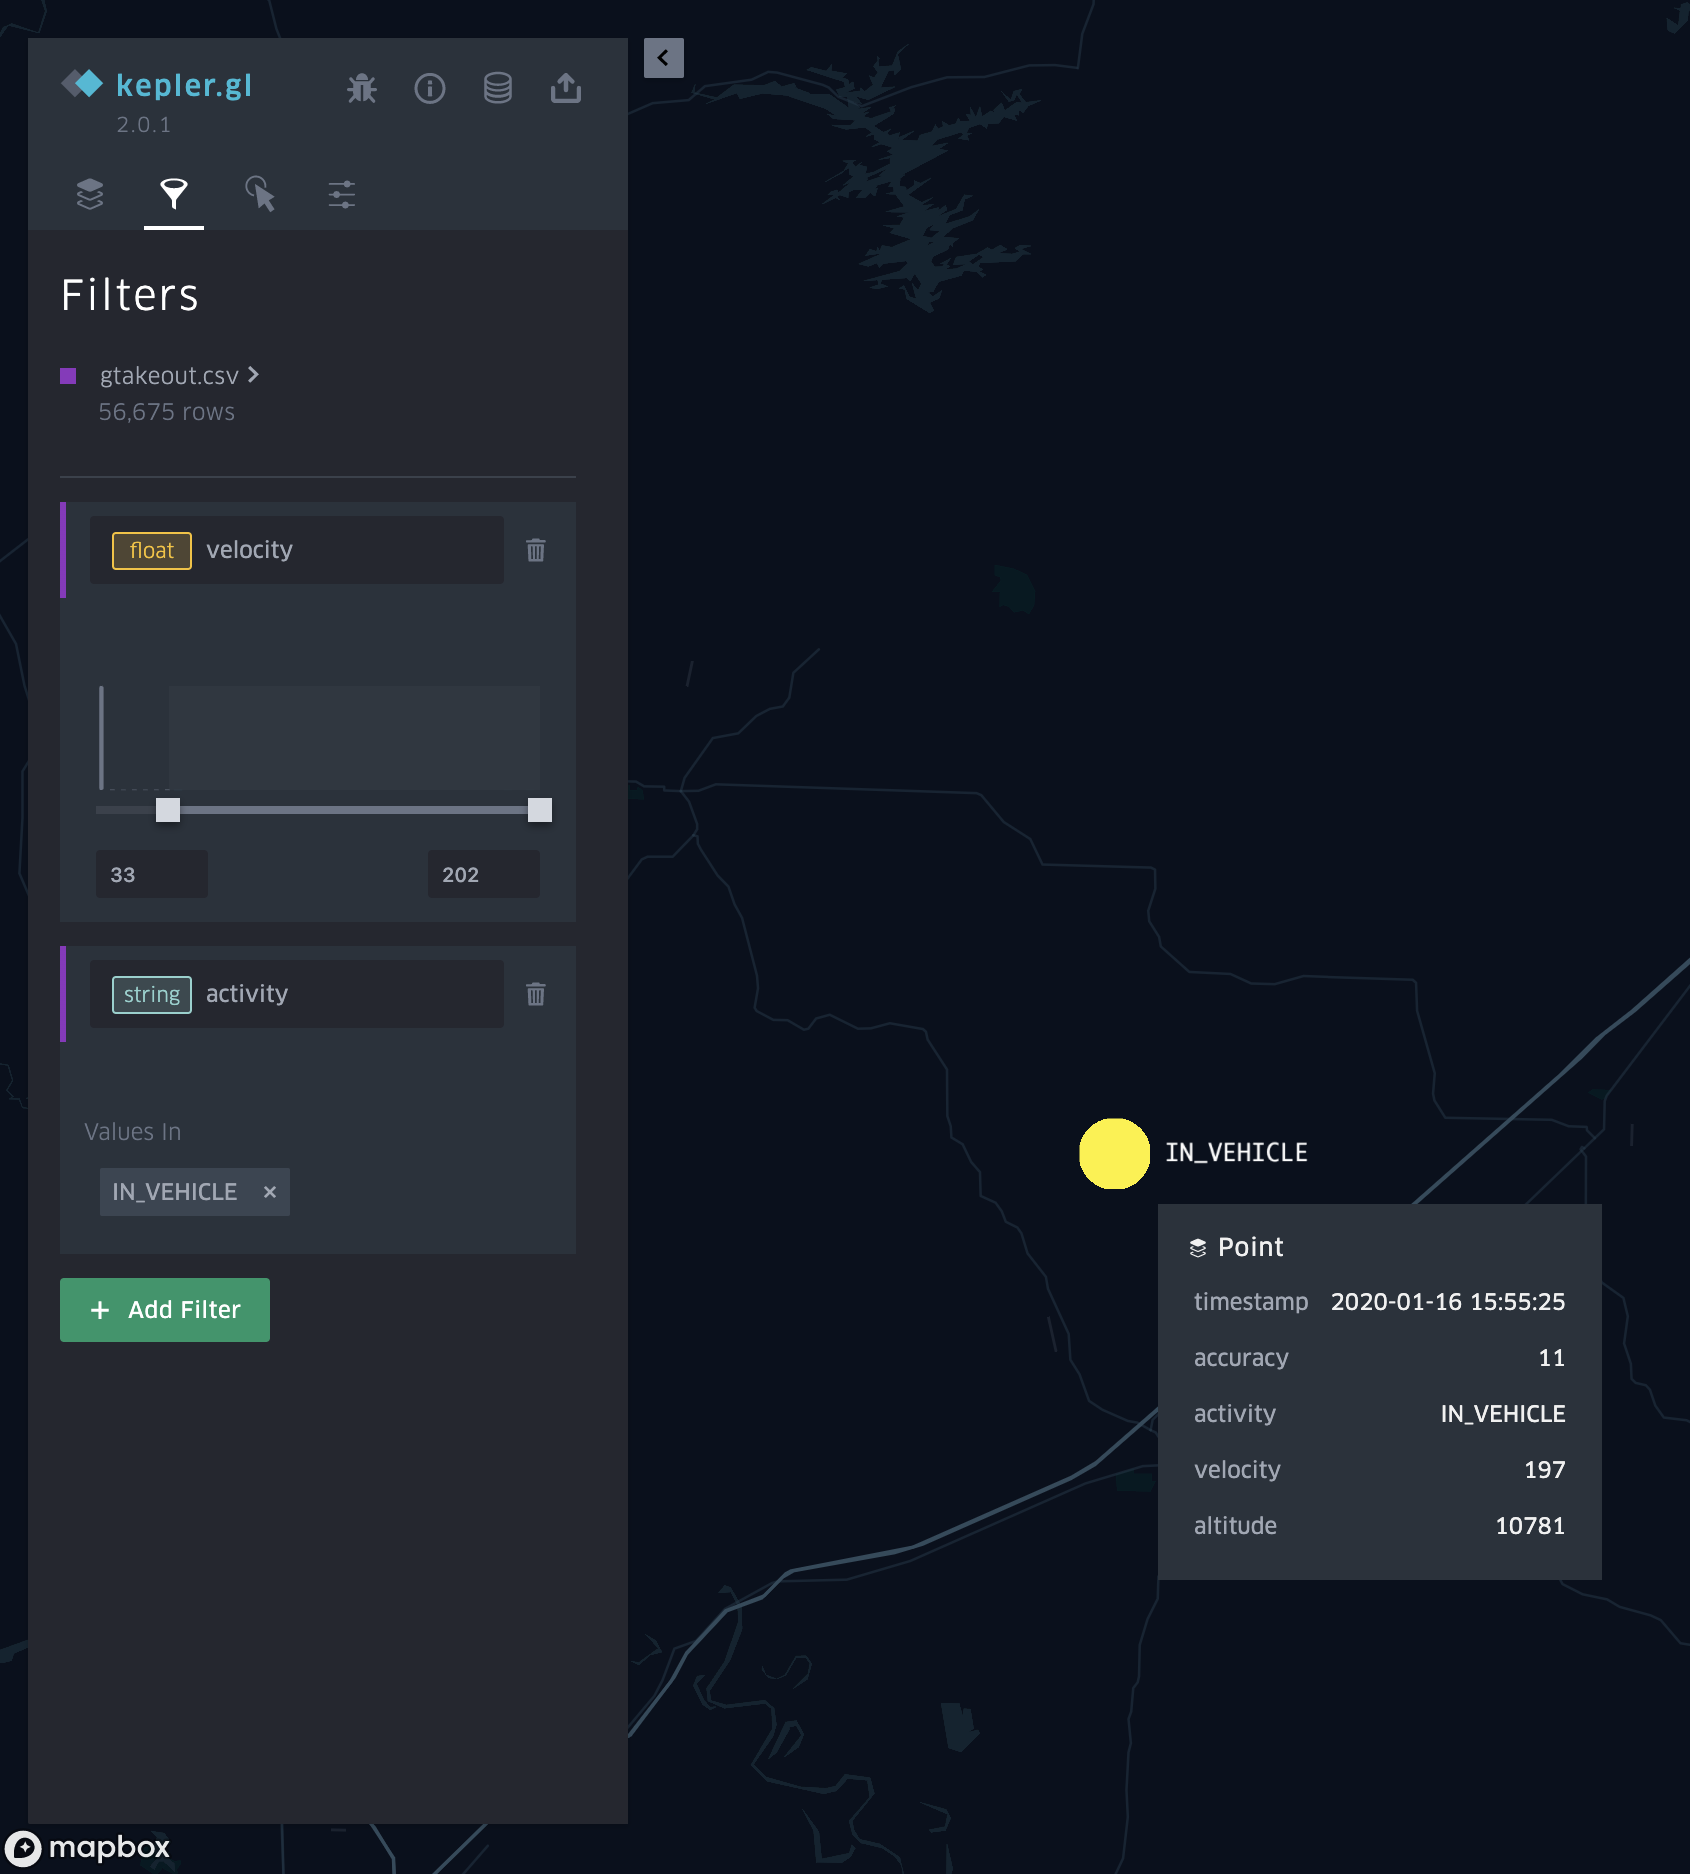
If we remove the filter for “IN_VEHICLE”, we see what looks like the mobile device is in an airplane in flight, shown in Figure 6. Yes, GPS works on planes and even in places with no cell service. A clear view of four satellites overhead is all that is required.
Conclusion
While GPS data can bring tremendous value to emergency response and criminal investigation, we need to keep in mind that GPS signals can easily be spoofed as well. Location spoofing software can trick a phone’s built-in GPS by transmitting a false set of coordinates, which allow device owners to virtually travel to any location in the world. Regardless of this limitation, we want to encourage both security teams and law enforcement looking into this new aspect from data collection and investigation point of view. As the number of IoT devices continue to grow, current open source tools and investigation techniques would serve as a strong foundation and provide reasonably easy ways for future applications.
For individual users who want to protect their GPS data, we recommend limiting the location tracking on your mobile apps. This can be easily customized in your privacy settings. In addition, users are encouraged to download apps only from trusted sources like App Store and Google Play, which will prevent users from installing spywares that secretly collect location data.
Table of Contents
Related Malware Resources

 High Profile Threats


 Threat Actor Groups