This post is also available in: 日本語 (Japanese)
Executive Summary
With the ever-increasing number of new vulnerabilities, vulnerability management becomes one of the most critical processes in ensuring continuous business operation. While it is clear that timely patching is essential, it’s also important to know quantitatively how a delay could increase risk. What is the chance that attackers breach my organization using a CVE just disclosed or using an unknown (zero-day) vulnerability? To understand the state of vulnerability disclosure and exploit development, Unit 42 researchers analyzed 45,450 publicly available exploits in Exploit Database at the time of this writing. The research correlated the exploit data with vulnerability and patch information to study exploit development in multiple facets.
The research reveals that:
- Of the 45,450 public exploits in Exploit Database, there are 11,079 (~26%) exploits in Exploit Database that have mapped CVE numbers.
- Among those 11,079 exploits:
- 14% are zero-day (published before the vendors release the patch), 23% are published within a week after the patch release and 50% are published within a month after the patch release. On average, an exploit is published 37 days after the patch is released. Patch as soon as possible – the risk of a vulnerability being exploited increases quickly after vendors release the patches.
- 80% of public exploits are published before the CVEs are published. On average, an exploit is published 23 days before the CVE is published. Software and hardware may also have vulnerabilities with public exploits that don't have CVEs. Check security updates from vendors frequently and apply updates as soon as possible.
We also reviewed the entire CVE list since 1999 and found that, on average, a CVE is published 40 days after its CVE-ID is assigned. Of the 177,043 entries we analyzed at the time of this writing, more than 10,000 CVEs have been in “reserved” status for more than two years. It shows that there is a long delay between vulnerability discovery and CVE publication.
Lastly, we looked at the top 10 most routinely exploited vulnerabilities in 2016-19 according to the U.S. Cybersecurity Infrastructure and Security Agency (CISA) to highlight the time difference between vulnerability, exploit and patch publication. Of note, major software vendors handle vulnerability patching much faster and have lower percentages of public zero-day exploits.
Palo Alto Networks customers can get assistance with vulnerability management through products including:
- The Threat Prevention subscription for the Next-Generation Firewall.
- Prisma Cloud, which can assist with vulnerability management by alerting users to and helping protect against attack scenarios, combining behavior-based analytics with the Prisma Cloud Intelligence Stream.
- Cortex XSOAR, which can help optimize vulnerability management.
Many Palo Alto Networks products are powered by high-fidelity threat intelligence from AutoFocus and WildFire, which help keep up to date on threats in the wild.
Exploit Database Overview
Exploit Database is the largest repository for public exploits. At the time of this writing, there are 45,450 exploits in Exploit Database. Figure 1 left shows the number of exploits categorized by the exploit type and publication year. Figure 1 right shows the distribution of exploits by platform. The statistics show that web applications have been the most popular exploited targets since 2003.
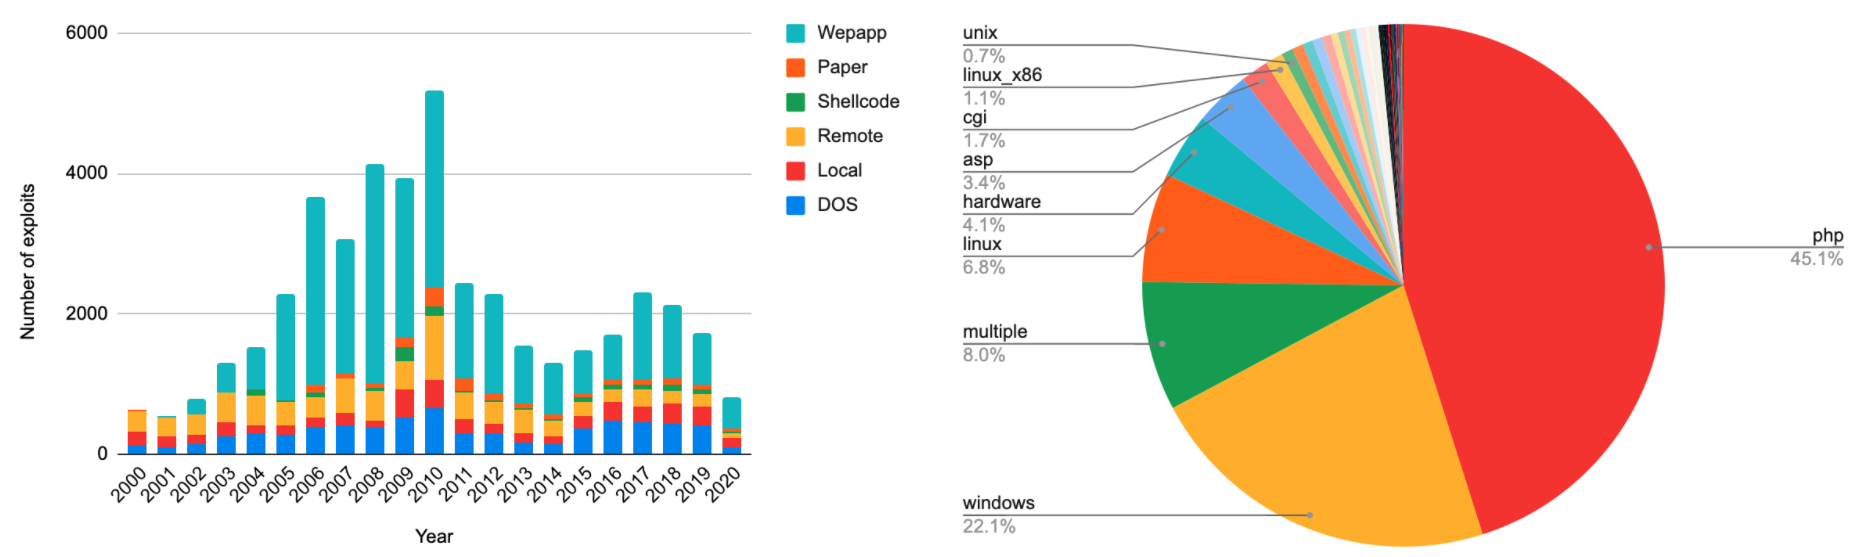
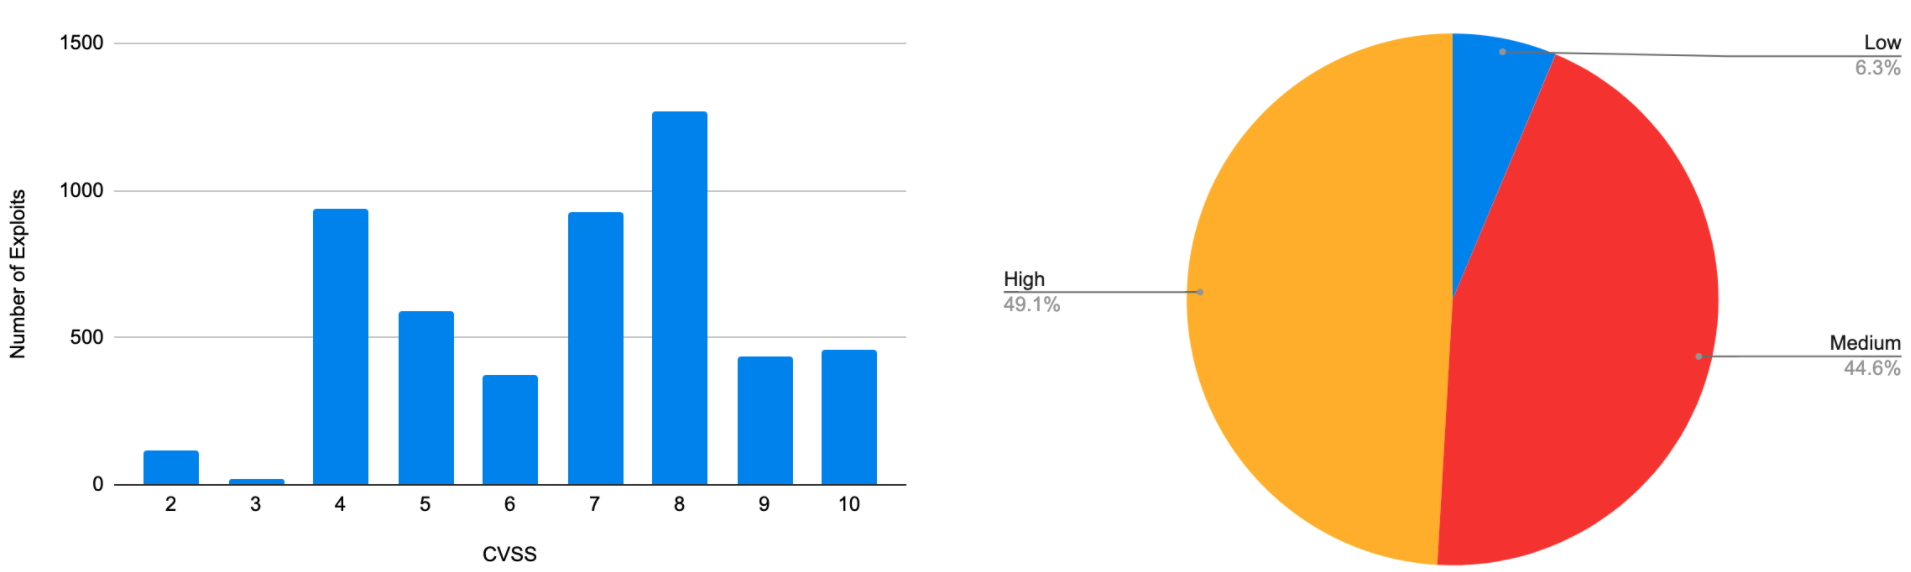
Figure 2 shows the Common Vulnerability Scoring System 2.0 (CVSS) scores and the severity of the exploits. 49% of the exploits have high severity (CVSS >=7), and 45% of the exploits have medium severity (CVSS <7 and CVSS >= 4). In other words, 94% of the public exploits are developed for vulnerabilities with medium or high severity.
Timing Between Vulnerability, Patch and Exploit
To better understand the impact of public exploits, we analyzed exploits and their associated CVEs together. Note that not every exploit has an associated CVE. Some exploits simply don’t have CVE entries, and some exploits may belong to CVEs that are not yet published. Currently, there are 11,079 (~26%) exploits in Exploit Database that have mapped CVE numbers. We focused on the exploits with CVEs and analyzed the timings between vulnerability, exploit and patch publication.
Figure 3 shows a timeline from vulnerability discovery to CVE publication. The exact vulnerability discovery time is usually unknown, but the times that CVE-ID is assigned and the times that CVEs are published can be found in the CVE database. Typically, CVEs are published right after the vendors release the patch. Once the patch is released, adversaries who have access to the updated software can uncover the vulnerability by reverse-engineering the patch. As we will see, most exploits are developed and published in the first week of patch release. Some vendors may delay the CVE publication to give their customers more time to update.
When a CVE is officially published, information about the vulnerability is immediately available to the entire world. This is whenmost security vendors start developing their vulnerability signature and protection strategy. It is also the time that most adversaries begin to exploit the vulnerabilities. In this time-sensitive game between hackers and defenders, whoever acts faster has a better chance to win. This means the publication timings between CVE, patch and exploit provide interesting context about the ongoing struggle for security.
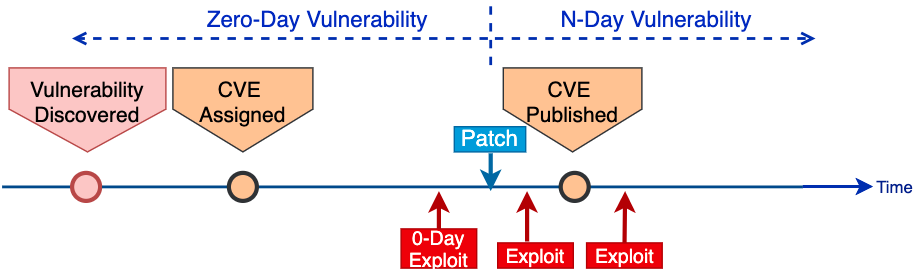
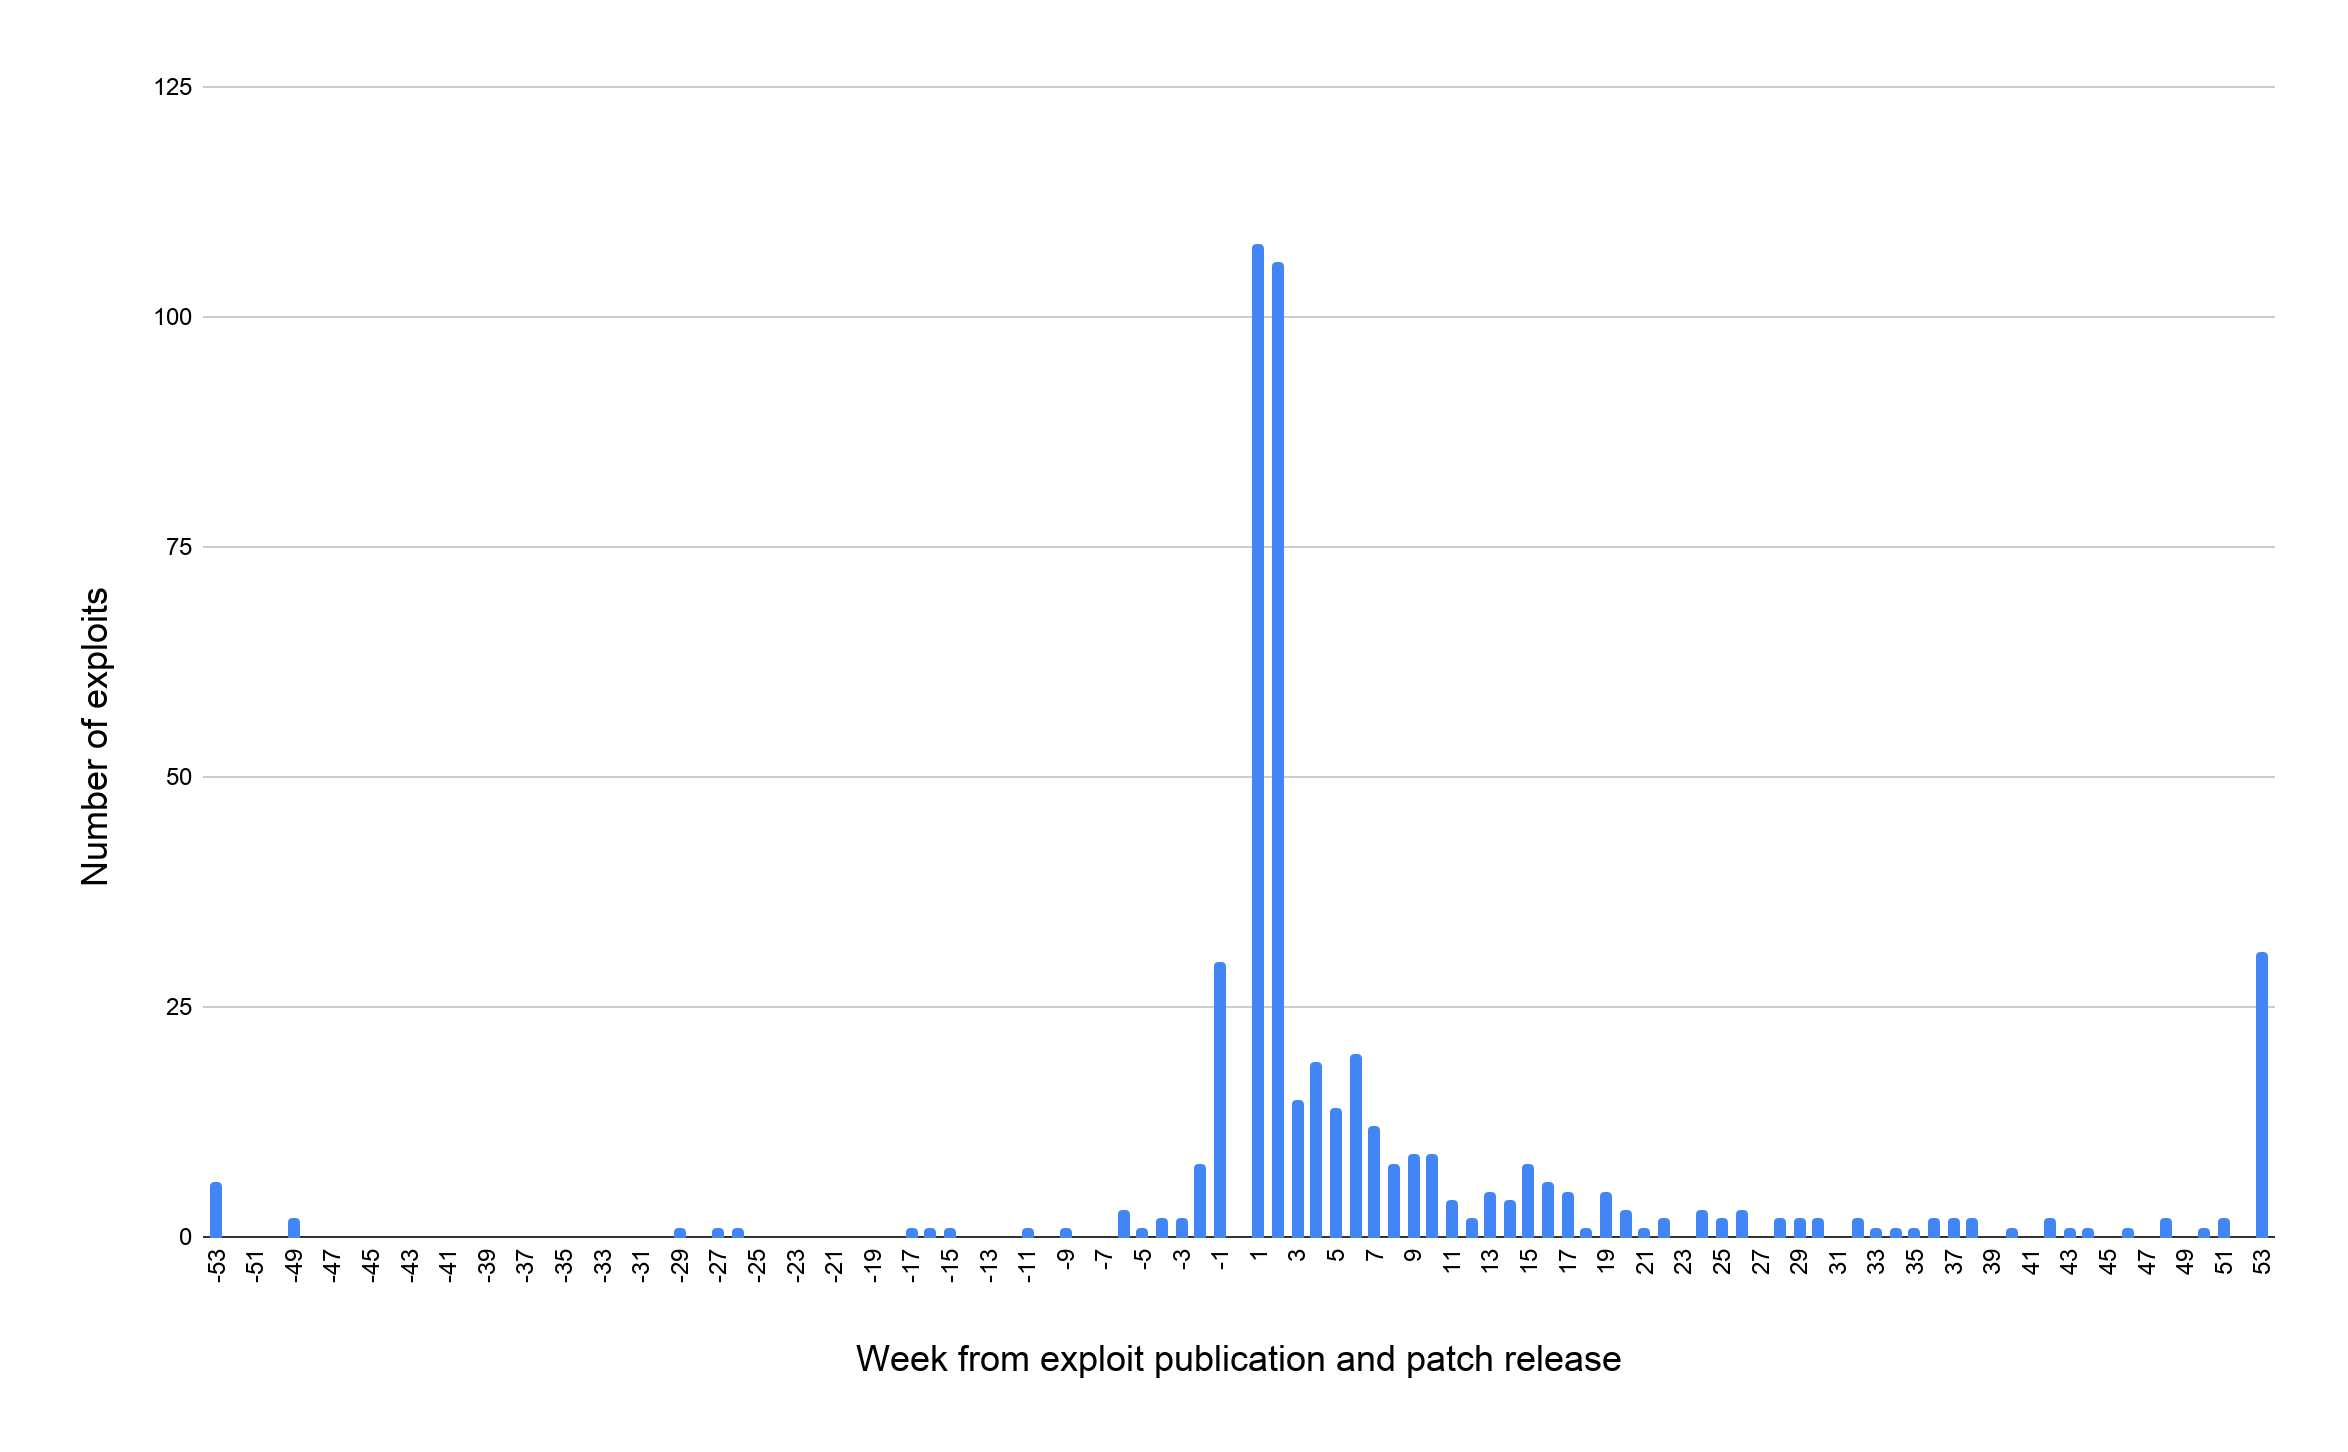
Figure 4 shows the number of exploits published in different weeks after the patches are released. The bar above week 1 indicates the number of exploits published in the first week of the patch release. Exploits published before the patch release date (zero-day exploits) have negative week indices. Because vulnerability patch dates are not available in Exploit Database or a CVE database, we sampled 500 high-severity exploits since 2015 and manually identified their patch dates from the vendor sites. 14% of the exploits we studied were published before the patches, 23% of the exploits were published in the first week and 50% of the exploits were published in the first month. On average, an exploit is published 37 days after the patch is released. Since exploits come out so quickly on average, it underscores how imperative it is for organizations to practice regular and timely patching – it’s all too common to see years-old vulnerabilities still unpatched in running systems.
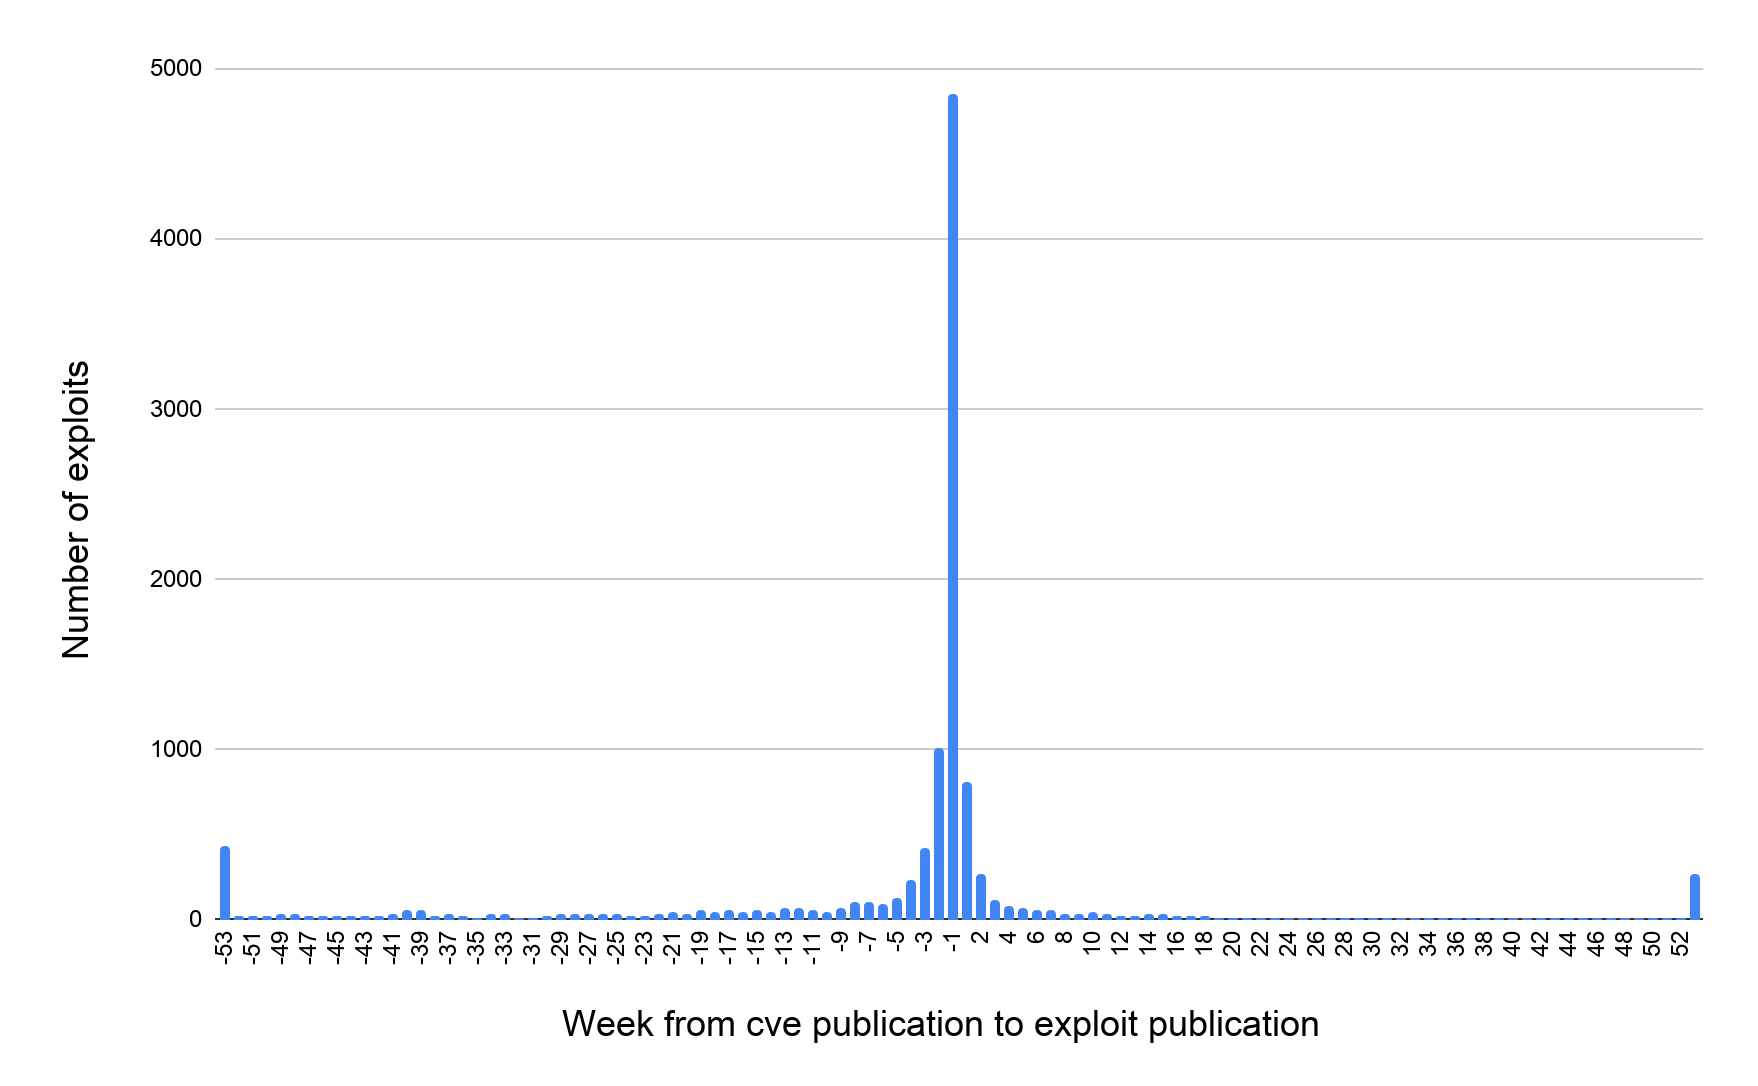
Figure 5 shows the number of exploits published in different weeks after the CVE is published. Similar to Figure 4, exploits published before the CVE publication have negative week indices. It is shocking to see that 80% of the exploits we studied were published before the CVEs are published. On average, an exploit is published 23 days before the CVE is published. On top of this, there are also the 75% of exploits in the database that don't have associated CVEs at all. We wondered what caused such a consistent discrepancy between the patch release date and CVE publication date. We looked into the CVE database (Figure 6) and found that not all CVEs are published immediately after the patch is released. As a result, there is a good chance that an exploit is already available when the CVE is officially published – illustrating one more way that attackers are too often a step ahead of security professionals.
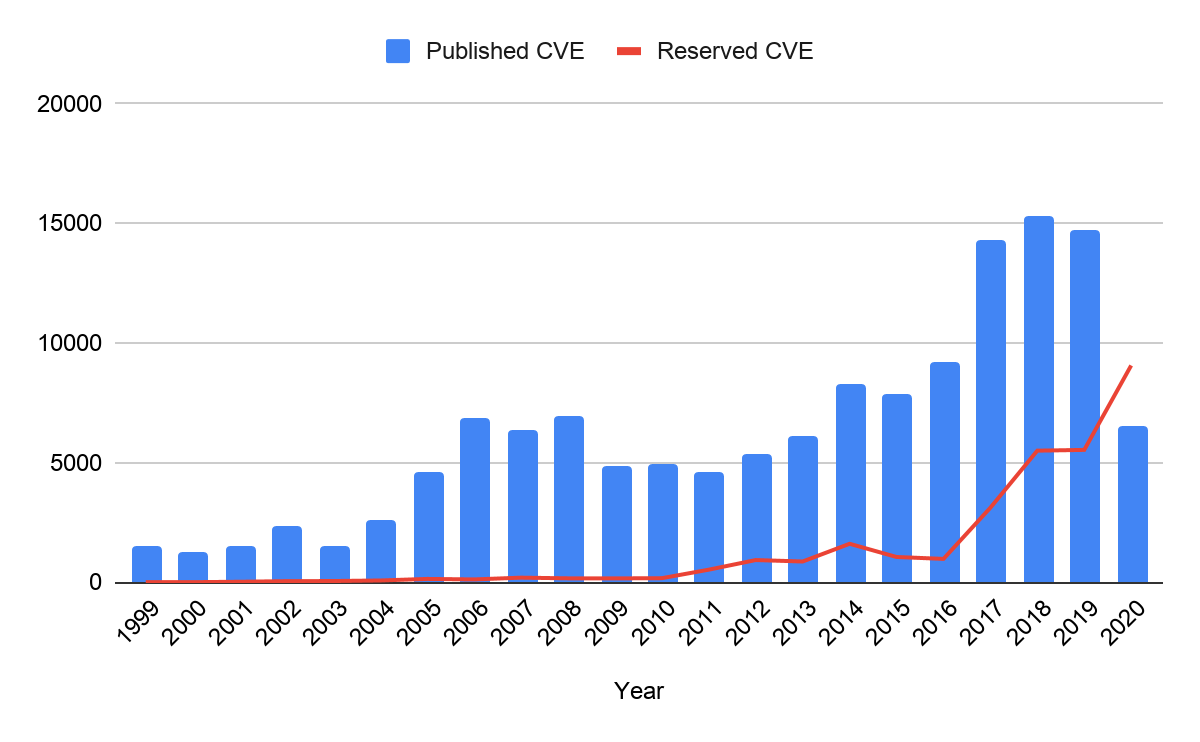
Once a CVE-ID is assigned to a vulnerability, this CVE stays in “reserved” status. Detailed information of the reserved CVEs is kept confidential until the CVE is officially published. At the time of this writing, we analyzed 177,043 entries in the CVE list and counted the number of reserved CVEs. Figure 6 shows the number of published CVEs and reserved CVEs since 1999. On average, a CVE is published 40 days after its CVE-ID is assigned. However, more than 10,000 CVEs have been in “reserved” status for more than two years. It shows that there is often a long delay between vulnerability discovery and CVE publication. While major vendors usually have their CVE published right after the patch release, some vendors fail to update their CVE status in a timely fashion. These numbers also explain why so many exploits are made public before the CVEs are officially published (Figure 5).
Case Study: Most Exploited Vulnerabilities from 2016-19
We looked into the exploits and patch information of the top 10 routinely exploited vulnerabilities that the U.S. Cybersecurity Infrastructure and Security Agency (CISA) published on May 12, 2020. Table 1 lists the details. If a CVE has multiple exploits in Exploit Database, the exploit publication date is based on the earliest published exploit. The patch information is obtained from the vendor advisory pages. In this smaller sample set, 10% of the exploits are zero-day and 40% of the exploits are available in the first week after the patch release. These numbers match the statistics drawn from Figures 4 and 5. The percentage of zero-day exploits or exploits published before the CVE disclosure is lower than what we observed in the larger sample because the most exploited vulnerabilities often affect prominent vendors such as Microsoft and Adobe, who can resolve vulnerabilities and release updates much faster than many other affected vendors . Many third-party vendors or open-source projects do not have sufficient resources to handle newly reported vulnerabilities and end up having exploits reach the public before the patches or CVE publication.
| CVE | Exploit-ID | CVE Published | Exploit Published | Patch Published | CVSS2 | Description |
| CVE-2017-11882 | 43163 | 11/14/2017 | 11/20/2017 | 11/14/2017 | 9.3 | Memory Corruption Vulnerability in Microsoft Office Equation Editor |
| CVE-2017-0199 | 41894,
41934, 42995 |
4/12/2017 | 4/18/2017 | 4/11/2017 | 9.3 | Microsoft Office/WordPad Remote Code Execution Vulnerability w/Windows API |
| CVE-2017-5638 | 41570,
41614 |
3/10/2017 | 3/7/2017 | 3/6/2017 | 10 | Apache Struts RCE Vulnerability |
| CVE-2012-0158 | 18780 | 4/10/2012 | 4/25/2012 | 4/10/2012 | 9.3 | MSCOMCTL.OCX RCE Vulnerability |
| CVE-2017-0143 | 41891,
41891, 41891 |
3/16/2017 | 4/17/2017 | 3/14/2017 | 9.3 | Windows SMB Remote Code Execution Vulnerability |
| CVE-2018-4878 | 44412 | 2/6/2018 | 4/6/2018 | 2/6/2018 | 7.5 | Adobe Flash Player Use-after-free Vulnerability. |
| CVE-2017-8759 | 42711 | 9/12/2017 | 9/13/2017 | 9/12/2017 | 9.3 | .NET Framework Remote Code Execution Vulnerability |
| CVE-2018-7600 | 44448,
44448, 44482 |
3/29/2018 | 4/13/2018 | 3/28/2018 | 7.5 | RCE Vulnerability in Drupal |
| CVE-2019-11510 | 47297 | 5/8/2019 | 8/21/2019 | 4/24/2019 | 7.5 | Pulse Secure Arbitrary File Reading Vulnerability |
| CVE-2019-19781 | 47901 | 12/27/2019 | 1/11/2020 | 1/19/2020 | 7.5 | Citrix Application Delivery Controller (ADC) Directory Traversal Vulnerability |
Table 1. Top 10 exploited vulnerabilities from 2016-19.
Conclusion
New vulnerabilities are discovered in ever-increasing velocity and volume. While not every vulnerability has an exploit publicly available, there is no doubt that the majority of known vulnerabilities have an exploit somewhere. A capable reverse-engineer can develop an exploit by analyzing the associated patch. The set of 45,450 public exploits we studied represents only a small part of the reality. Many exploits are privately owned and are only traded in black markets. The number of exploits and speed of exploit development observed in our research are most likely underestimated because we did not investigate private sources. The research reaffirms the importance of timely patching and updating. The chance of being compromised increases quickly as soon as the vulnerability’s patch is released. With many vulnerability scanning tools freely available, and knowing that most vendors have patches available before the CVE disclosure, there is no reason to delay any update.
Palo Alto Networks customers can get assistance with vulnerability management through products including:
- The Threat Prevention subscription for the Next-Generation Firewall.
- Prisma Cloud, which can assist with vulnerability management by alerting users to and helping protect against attack scenarios, combining behavior-based analytics with the Prisma Cloud Intelligence Stream.
- Cortex XSOAR, which can help optimize vulnerability management.
Many Palo Alto Networks products are powered by high-fidelity threat intelligence from AutoFocus and WildFire, which help keep up to date on threats in the wild.
Table of Contents
Related Vulnerabilities Resources


 High Profile Threats