
Executive Summary
Tracking network scanning activities can help researchers understand which services are being targeted. By monitoring the origins of the scanners, researchers can also identify compromised endpoints. If a host belonging to a known organization suddenly starts to scan a part of the internet, it is a strong indicator that the host is compromised.
This blog summarizes our findings over a four-month period, from May-August 2021. On average, we identified 75,000 unique scanner IP addresses globally that enumerated more than 9,500 different ports every day. On an internet-facing endpoint, we observed 1,500 unique scanner IPs targeting 1,900 ports daily. Because not every scanner scans the entire IPv4 address space, the number of scanners observed on each endpoint is lower than the total number of scanners observed globally.
Samba, Telnet and SSH were the three most scanned services, accounting for 36% of scanning traffic globally. Among all the scanners we observed, 64% of the IPs appeared only once throughout the four months, while 0.15% of the IPs appeared every day. The high percentage of ephemeral IPs indicates that the majority of the scanners are difficult to track. On the other hand, most legitimate scanning service providers – such as Shodan, Censys and Shadowserver – usually use a fixed set of IPs and make their scanners identifiable via explicit user agents or domain names. A list of the most frequent scanner IPs identified in this research is available on GitHub.
Prisma Cloud is a comprehensive cloud native security platform that protects cloud workloads across multiple cloud service providers (CSPs). Unit 42 researchers analyzed trillions of Flow Logs collected by Prisma Cloud to extract network scanning traffic. Combining threat intelligence from AutoFocus and WildFire, Prisma Cloud continuously monitors malicious traffic targeting our customers and malicious traffic originating from our customers' cloud environments.
Scanning Traffic Identification
Flow Logs are a feature that logs the IP traffic flowing to and from cloud resources such as virtual machines (VMs), containers and functions. All major CSPs offer their versions of Flow Logs (AWS, Azure and GCP). Like NetFlow data, Flow Logs are far less detailed than full packet captures but provide an efficient way to monitor network performance and security issues at scale. Typically, each Flow Log record includes source IP, destination IP, source port, destination port, IP protocol number, packet size, byte size and timestamp. Depending on the CSP, each flow record may include additional cloud-specific information such as account ID and resource ID.
Because Flow Logs do not have Layer 7 application information, it is difficult to determine if a flow carries scanning payloads from a single record. However, with the Flow Logs from tens of thousands of endpoints, we can reliably identify the scanning traffic by correlating flow records between multiple CSPs, regions and customers. If a source IP reaches a large number of endpoints within a short time and all flows have a similar byte/packet size, there is a strong indication that the source IP is performing a scanning operation. Below are the metrics and conditions we use to identify scanning traffic in Flow Logs:
- The source IP reaches multiple endpoints in different CSPs, accounts and regions.
- The source IP reaches all the endpoints in a short timeframe (e.g. within six hours).
- The source IP uses the same protocol to reach the same port on all the endpoints (e.g. TCP on port 22 ).
- The source IP has a similar traffic pattern across all the endpoints. In particular, the variance of packet size, byte size and flow count across all the endpoints need to be lower than a threshold.
Scanning Traffic Characteristics
Internet-wide scanning traffic typically performs only reconnaissance and doesn't carry malicious payloads. However, malicious actors can use the scanning results to identify a victim, learn the victim's infrastructure and find potential entry points. From a defense perspective, network scanning information can help understand attackers' targets. Knowing the scanning traffic, SOC analysts can also filter it out from the network logs to make forensic jobs more efficient.
Figure 1 shows the top 20 countries where the scanner IPs originated. 25% of the scanning traffic came from either China or India. Prior research has shown that some internet service providers (ISPs) tend to have more malicious or attack traffic than others (see the following reports: Regional Threat, ASN Report and Domain Research).
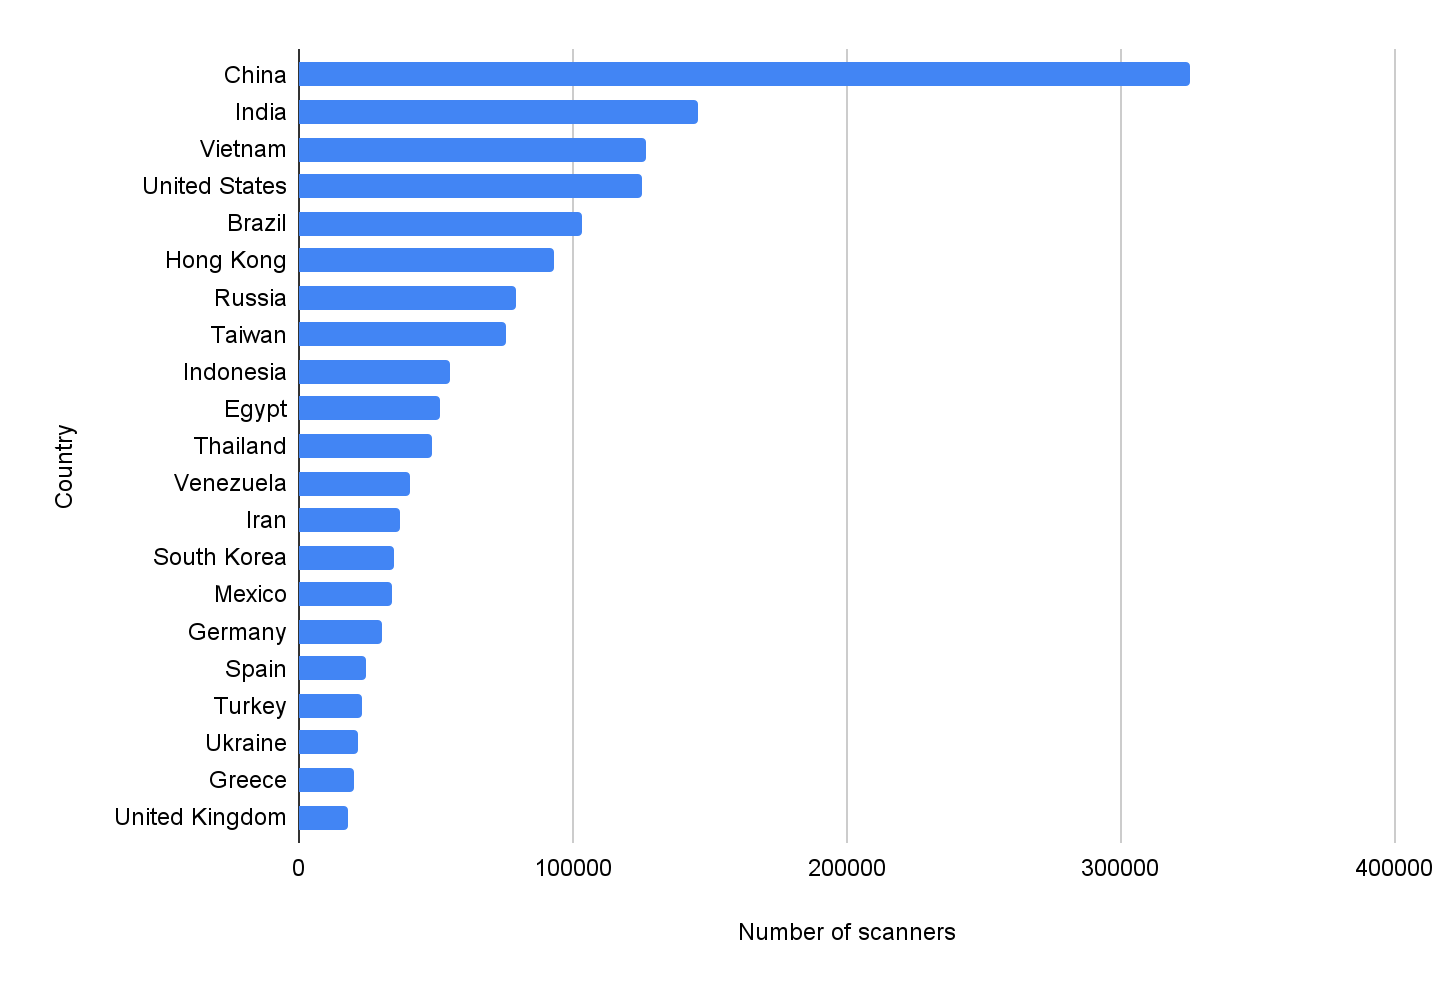
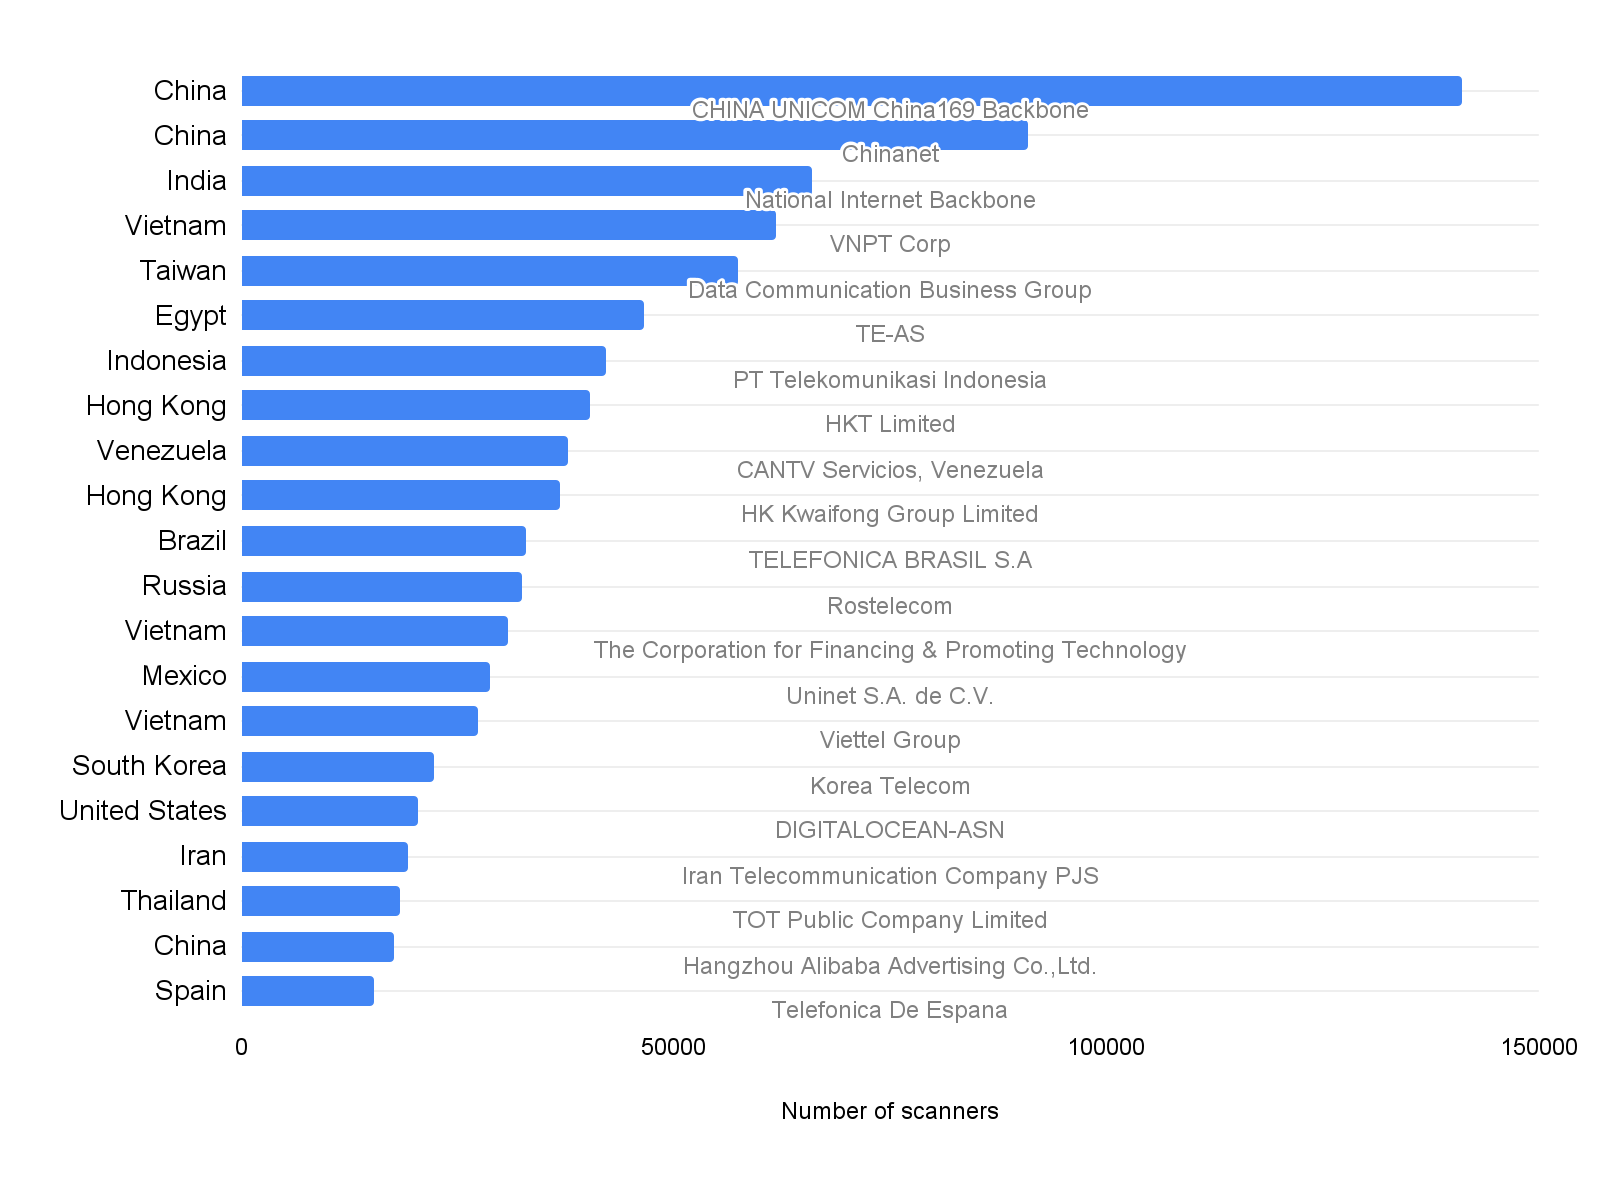
Figure 2 looks into the ISPs that host the largest number of scanners. Out of the 760 ISPs we observed, the top two ISPs, CHINA UNICOM China169 Backbone and Chinanet, host 13% of the scanners. As most ISPs detect and ban their customers from generating scanning traffic, these top 20 ISPs likely have less restrictive policies on their clients' bandwidth usage. Note that these scanning activities may occur intentionally or unintentionally in customers’ environments. ISPs are not liable for their customers’ activities – such as using their IP addresses for scanning the internet.
Overall, 96% of the scanning traffic is TCP, and only 4% of the traffic is UDP. Figures 3 and 4 show the most frequently scanned ports and protocols. Figure 3 shows the top 20 ports scanned by TCP, and Figure 4 shows the top 10 ports scanned by UDP. The label on each bar indicates the most commonly seen services deployed on the specific port and protocol. For example, Samba service typically runs on TCP port 445 and session initiation protocol typically runs on UDP port 5060.
Interestingly, one of the top three services is a half-century-old protocol, Telnet. Telnet is a simple command-line remote server management protocol that does not provide any security mechanism and was long ago replaced by the more secure protocol SSH. Based on prior Unit 42 research (Mirai Variant, Exploited SOHO Routers), we believe the scanning traffic is searching for misconfigured IoT devices that left Telnet services exposed and unprotected.
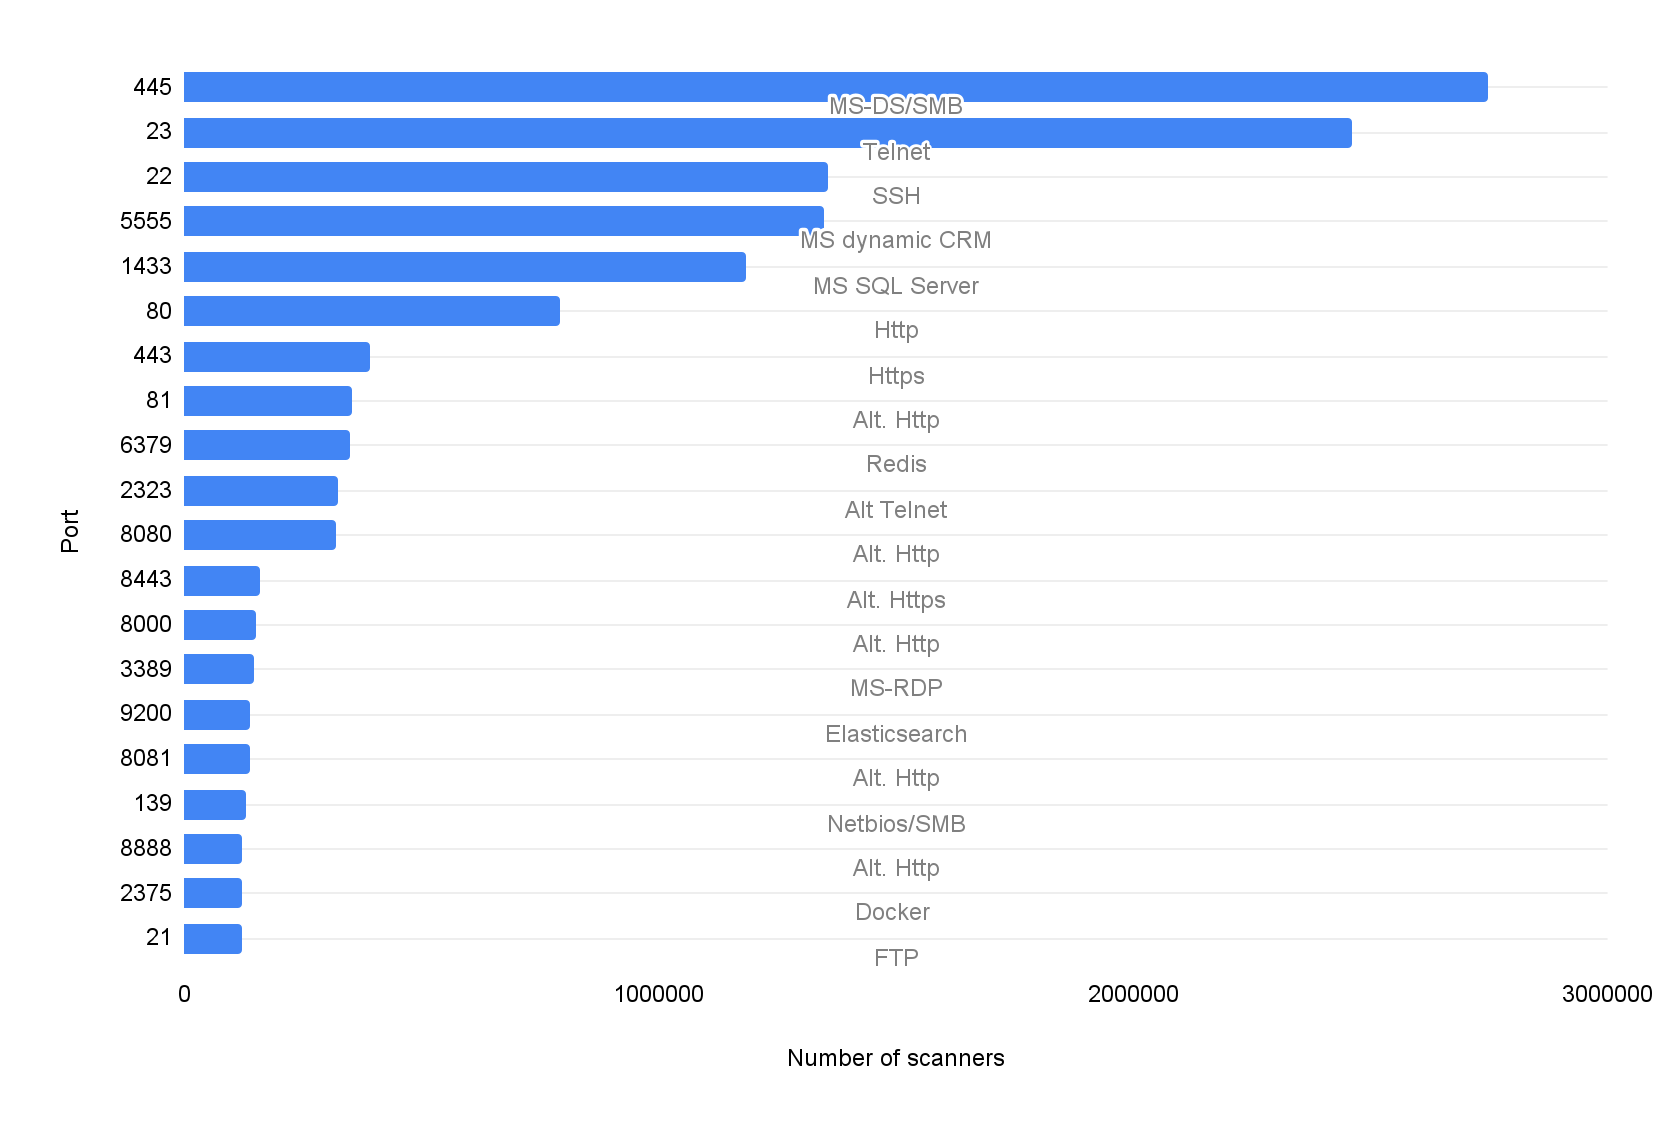
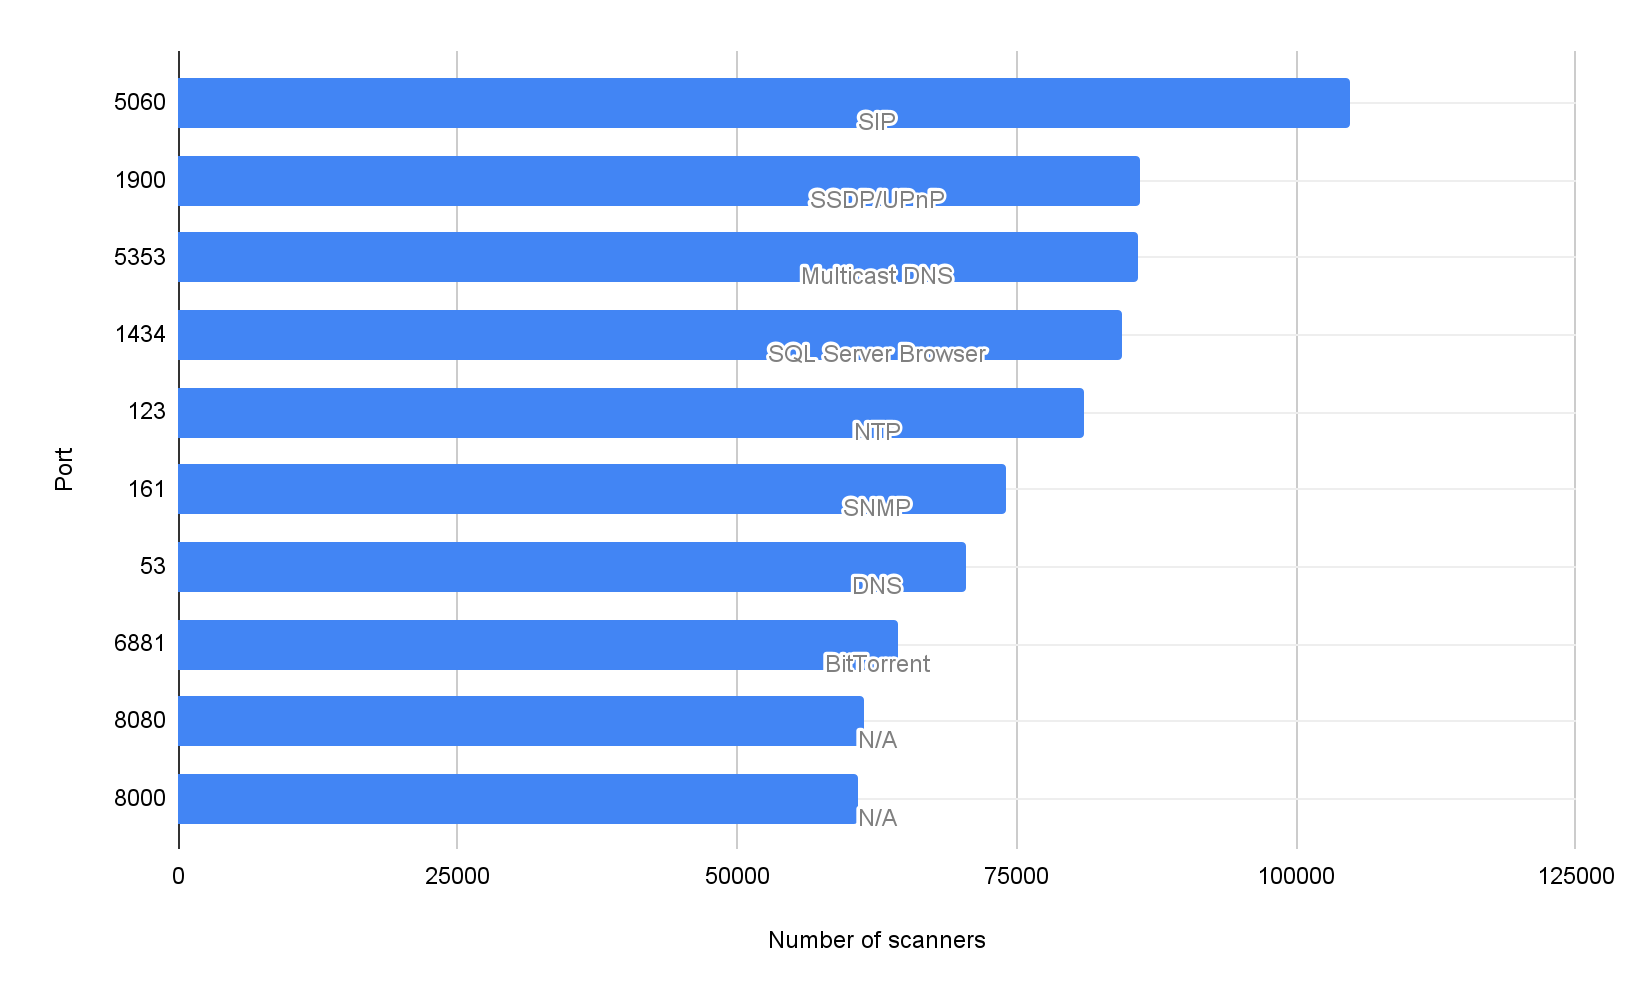
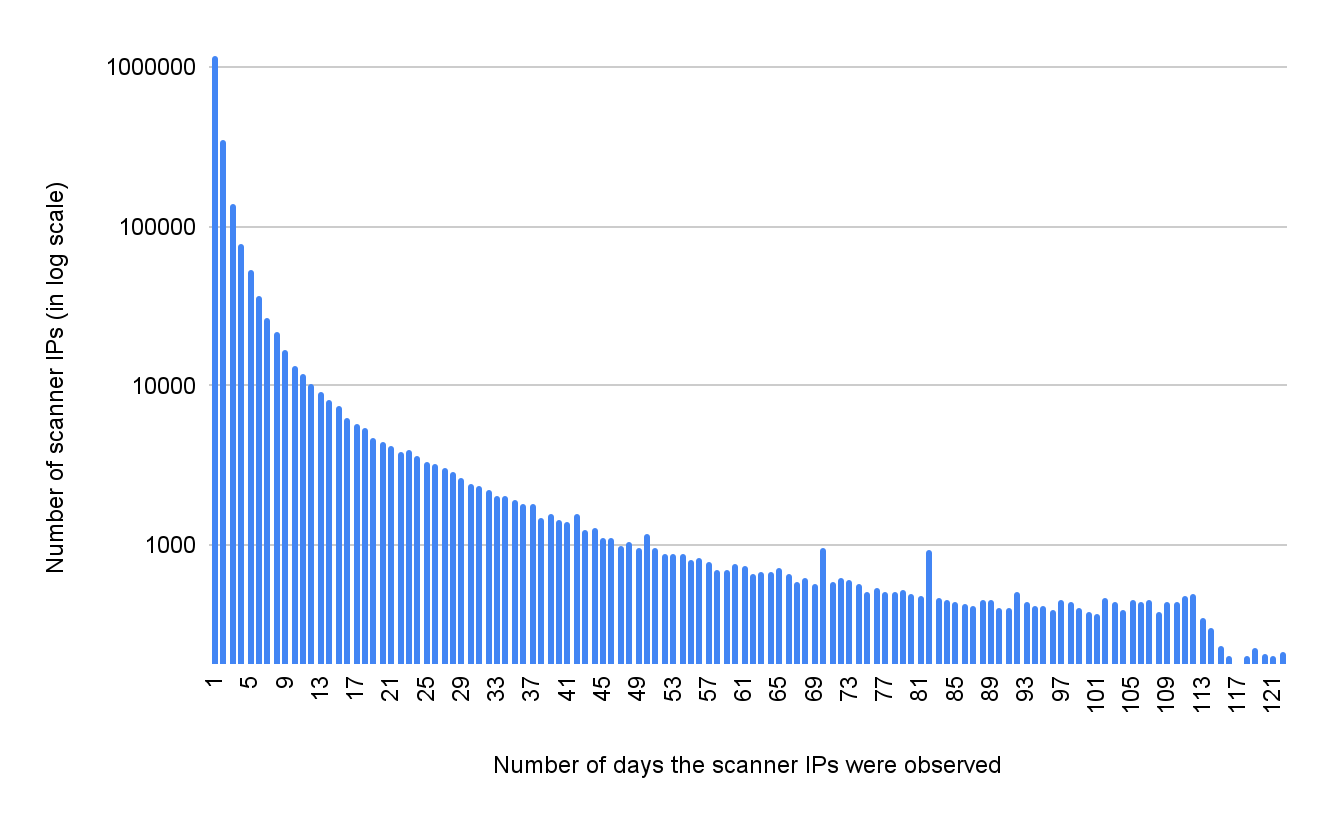
Figure 5 shows the number of days each scanner IP was observed. When a scanner IP appears on only one day, this indicates that the scanner never reused the same IP in the past four months. A scanner that appears on all 121 days indicates the scanner uses a static IP to scan the Internet daily. Overall, 64% of the scanner IPs appeared only once in the past four months, and 0.15% appeared daily. We published a subset of the IPs that we observed daily. These IPs scanned the ten most targeted ports (Figures 3-4) in the past 90 days.
Conclusion
Network scanning activities are like background noise on the Internet. They are prevalent but not targeted. The main goal is to reach as many hosts as possible and identify the active services on those hosts. The scanning traffic typically is not malicious and incurs minimal bandwidth. However, cybercriminals can use the scanning results to identify potential victims. It takes only a few minutes for attackers to discover a newly exposed service on the Internet. If the service has insecure configurations or known vulnerabilities, attackers can compromise it in a few seconds.
As most of these scanner IPs are dynamic (64%), it is difficult to track or block scanning traffic. However, good cyber hygiene can effectively mitigate the threats from these scanners. We recommend the following best practices:
- Minimize exposure to the Internet. Most of the top 20 services in Figure 3 shouldn't be exposed to the entire Internet.
- Use application firewalls to protect internet-facing services such as HTTP/HTTPs.
- Use an attack surface management service such as Cortex Xpanse to monitor exposed infrastructure.
Table of Contents
Related Cloud Cybersecurity Research Resources