
![]() Executive Summary
Executive Summary
From May 1-July 21, 2020, Unit 42 researchers captured global network traffic from firewalls around the world and then analyzed the data to examine the latest network attack trends. The majority of attacks we observed were classified as high severity (56.7%), and nearly one quarter (23%) were classified as critical. The most common vulnerabilities exploited were CVE-2012-2311 and CVE-2012-1823, both command injection vulnerabilities in PHP CGI scripts. This indicates that attackers are looking for exploits with high impact.
We analyzed the network attacks in terms of the countries from which they originated. Of note, China overwhelmingly had the highest activity, followed by Russia and the United States. This may be in part because of the large population that China, Russia and the United States have, as well as the high amounts of internet use in those countries. Attacks may also appear to originate from countries that don’t correspond to the attackers’ physical locations: Some attackers use proxy servers and anonymizers to hide their locations. Indeed, it may be strategically advantageous for attackers to conduct their activities in a way that suggests their activity is emanating from other specific target countries.
Malicious activity was highest on Mondays, and fewer attacks were observed during the weekends and holidays. Many attackers also attempted to conceal their identities by using Tor and other anonymity services.
Palo Alto Networks customers are protected from network attacks by updating their Next-Generation Firewalls with the latest Threat Prevention signature releases.
Data Collection
All the data for our research was collected from a system designed for detecting false positives with our firewall signatures. The system aggregates threat triggers from specific firewalls in multiple geographic locations. Although it was originally developed for identifying false positives, we were able to utilize it for detecting potential false negatives by creating special types of signatures we call “test signatures.”
Unlike regular threat signatures, these test signatures have much broader coverage and are intended to detect general categories of vulnerabilities as well as the malicious network activity that is often observed from attackers during exploitation. In most cases, the triggers from these test signatures will overlap with our regular signatures and they will detect the same malicious activity. However, when they catch activity that is not detected by our regular signatures, we analyze them more closely to determine whether they are false negatives.
Due to the large volume of traffic that goes through our firewalls and attackers’ tendency to make repeated use of their exploits, we observed many triggers that were caused by similar network data. To make manual analysis more efficient, we grouped together these duplicate triggers so that HTTP requests with related attributes would not need to be examined more than once. The discoveries in this blog are based on the data we collected and analyzed between May 1 and July 21, 2020.
In addition to the trends presented here, these prior Unit 42 blogs were also written with the data collected for this project:
- Exploits in the Wild for vBulletin Pre-Auth RCE Vulnerability CVE-2020-17496
- Lucifer: New Cryptojacking and DDoS Hybrid Malware Exploiting High and Critical Vulnerabilities to Infect Windows Devices
- Grandstream and DrayTek Devices Exploited to Power New Hoaxcalls DDoS Botnet
- New Mirai Variant Targets Zyxel Network-Attached Storage Devices
How Severe Were the Attacks?
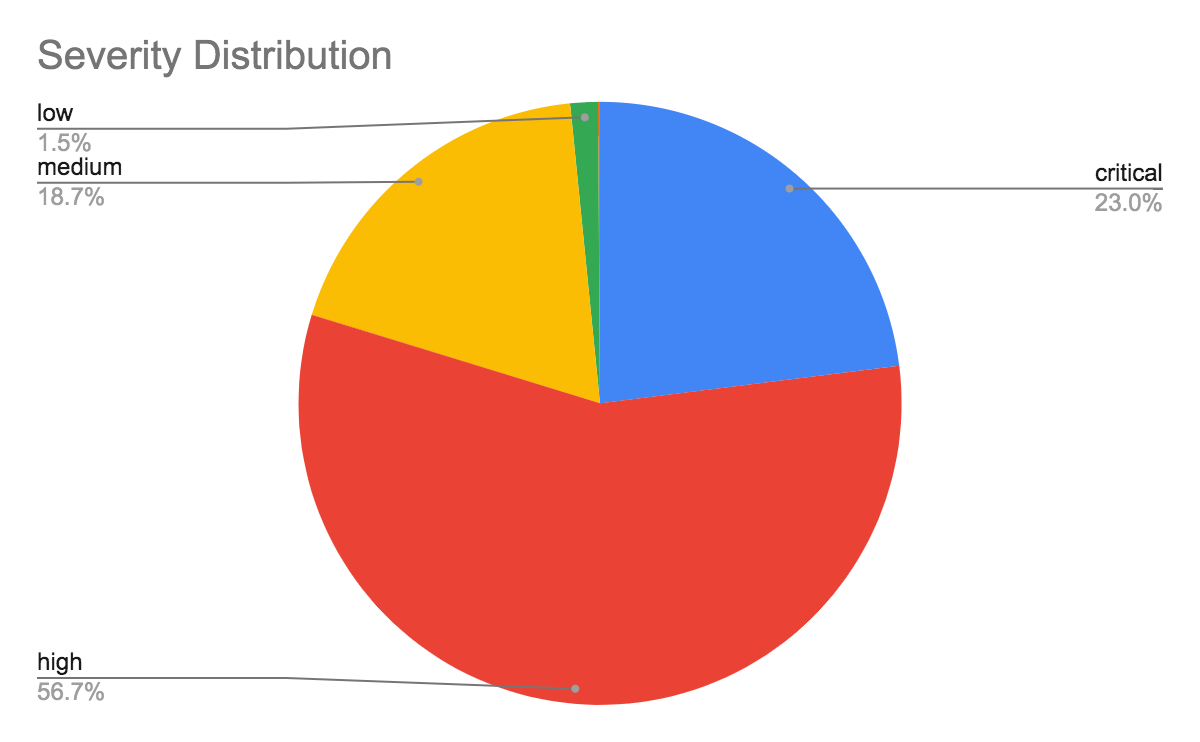
Every firewall signature has a level of severity assigned to it that indicates the possible impact of the threat. The majority of attacks we observed were classified as high severity (56.7%), and nearly one quarter (23%) were classified as critical. This indicates that attackers are more interested in utilizing exploits that result in high impact, such as completely compromising a web server through remote code execution (RCE) vulnerabilities.
Signatures with low and medium severity are used to detect scanning and brute-forcing attempts.
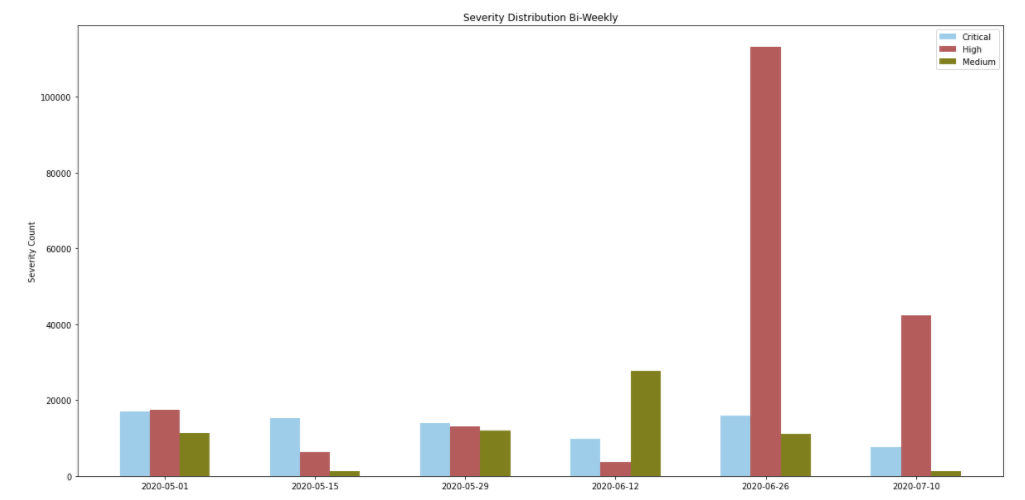
When Did the Attacks Occur?
We collected data for 81 days, and we discovered that the largest number of attacks occurred during the week of June 26, with major attacks including exploits of CVE-2012-2311 and CVE-2012-1823. While the frequency of critical attacks was mostly consistent, the frequency of attacks with medium and high severity fluctuated much more.
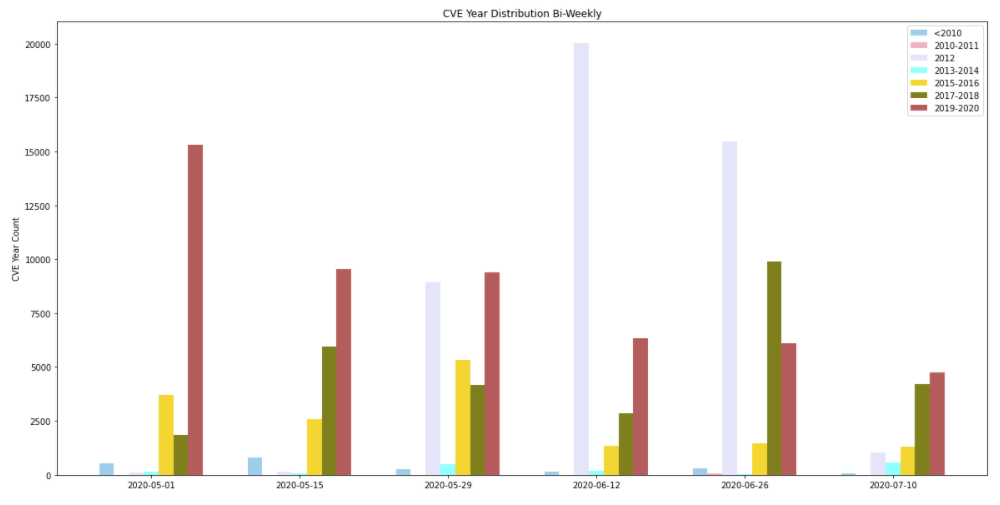
Attackers also made frequent use of newer vulnerabilities – disclosed within the past year. This highlights the importance of applying security patches as soon as they become available to provide protection against the most recently discovered vulnerabilities.
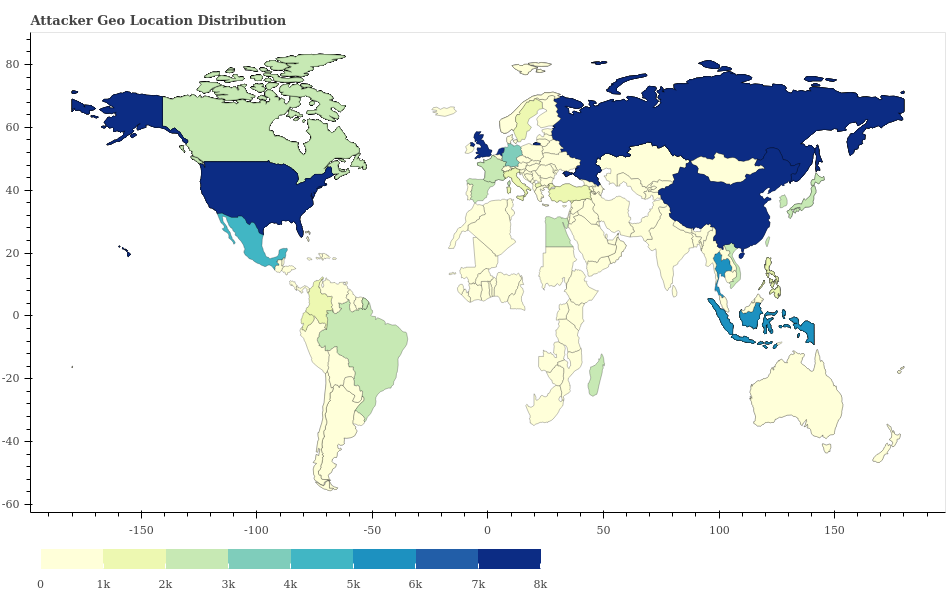
Where Did the Attacks Originate?
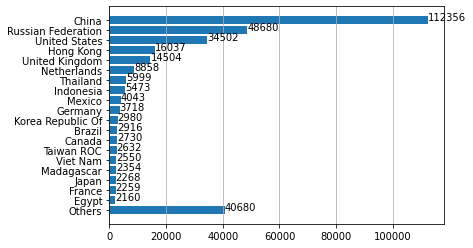
After identifying the country from which each network attack originated, we discovered that by far the largest number of them originated from China, followed by Russia and the United States. This may be in part because of the large population that China, Russia and the United States have, as well as the high amounts of internet use in those countries. Note that the countries that we observe don’t necessarily correspond to the physical location of the attackers. Attackers might use proxy servers and anonymizers to add extra hops to hide their locations. We will elaborate on the usage of proxy servers and anonymizers in the next section.
Domain Category Analysis
We collected the domain information from two sources: (1) host name and request URL from the network traffic and (2) reverse DNS domain names from the source and destination IP addresses. For each domain name, we use the existing Palo Alto Networks URL Filtering Service to map the domain name to a category. The idea is to look at the domain category to get more information about the types of domains that network attacks are associated with (Figure 6).
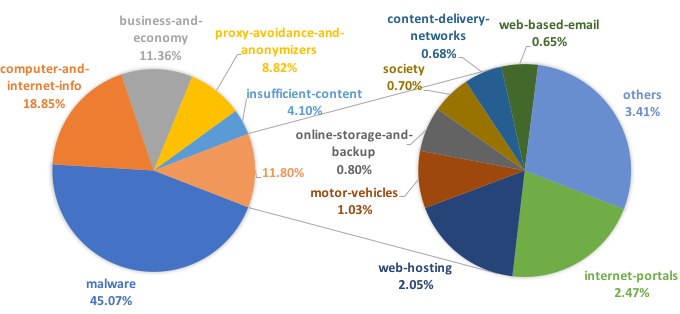
From Figure 6, we can see that 45.07% of the traffic we observed comes from malicious domain names. For the rest of the traffic, attacks are embedded in legitimate websites as redirected URLs. One interesting thing to notice is that 8.82% of the traffic falls into the proxy-avoidance-and-anonymizers domain category, which suggests the usage of proxy services or anonymity services for attacks to hide their original source. Tor is one of the most famous open-source anonymizers, which can help direct network traffic through volunteer overlay nodes and hide the original source addresses. The CVE analysis section on CVE-2012-2311 below shows evidence of the usage of Tor.
CVE Analysis
When a signature is designed to protect against a certain vulnerability, it will have a CVE number associated with it. After analyzing the data, we discovered the top 10 most common CVE numbers involved are:
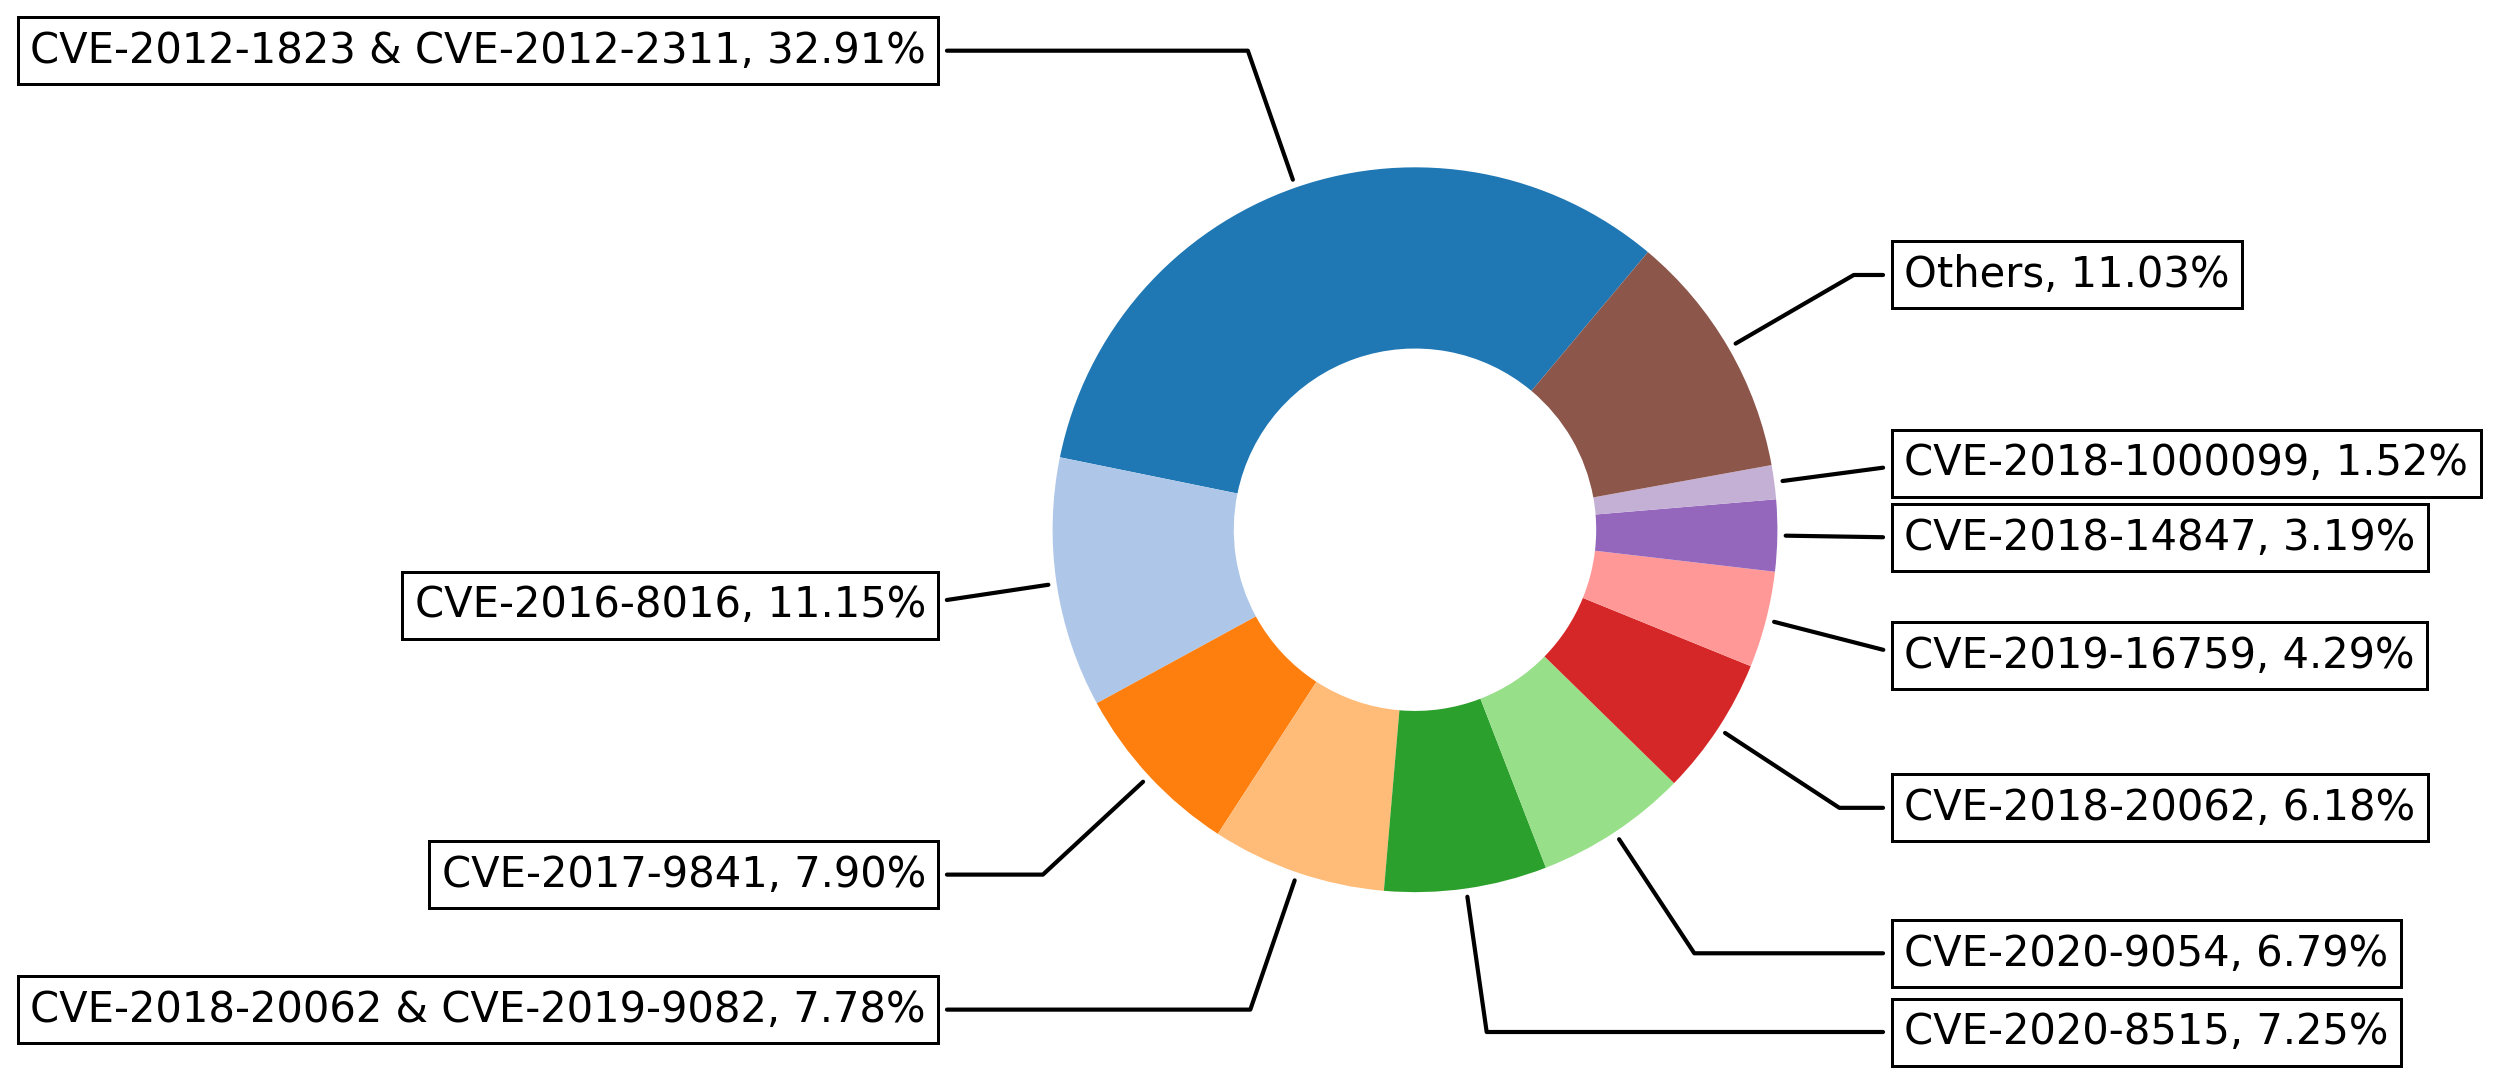
Attackers can exploit the vulnerabilities in CVE-2012-2311 and CVE-2012-1823 to execute arbitrary code on the victim machines. Specifically,
- CVE-2012-2311: php-cgi in some PHP versions (before 5.3.13, and 5.4.x before 5.4.3) does not properly handle query strings that contain a %3D sequence but no “=” character, which allows remote attackers to execute arbitrary code by placing command-line. This vulnerability exists because of an incomplete fix for CVE-2012-1823.
- CVE-2012-1823: php-cgi in some PHP versions (before 5.3.12, and 5.4.x before 5.4.2) does not properly handle query strings that lack an “=” character, which allows remote attackers to execute arbitrary code by placing command-line.
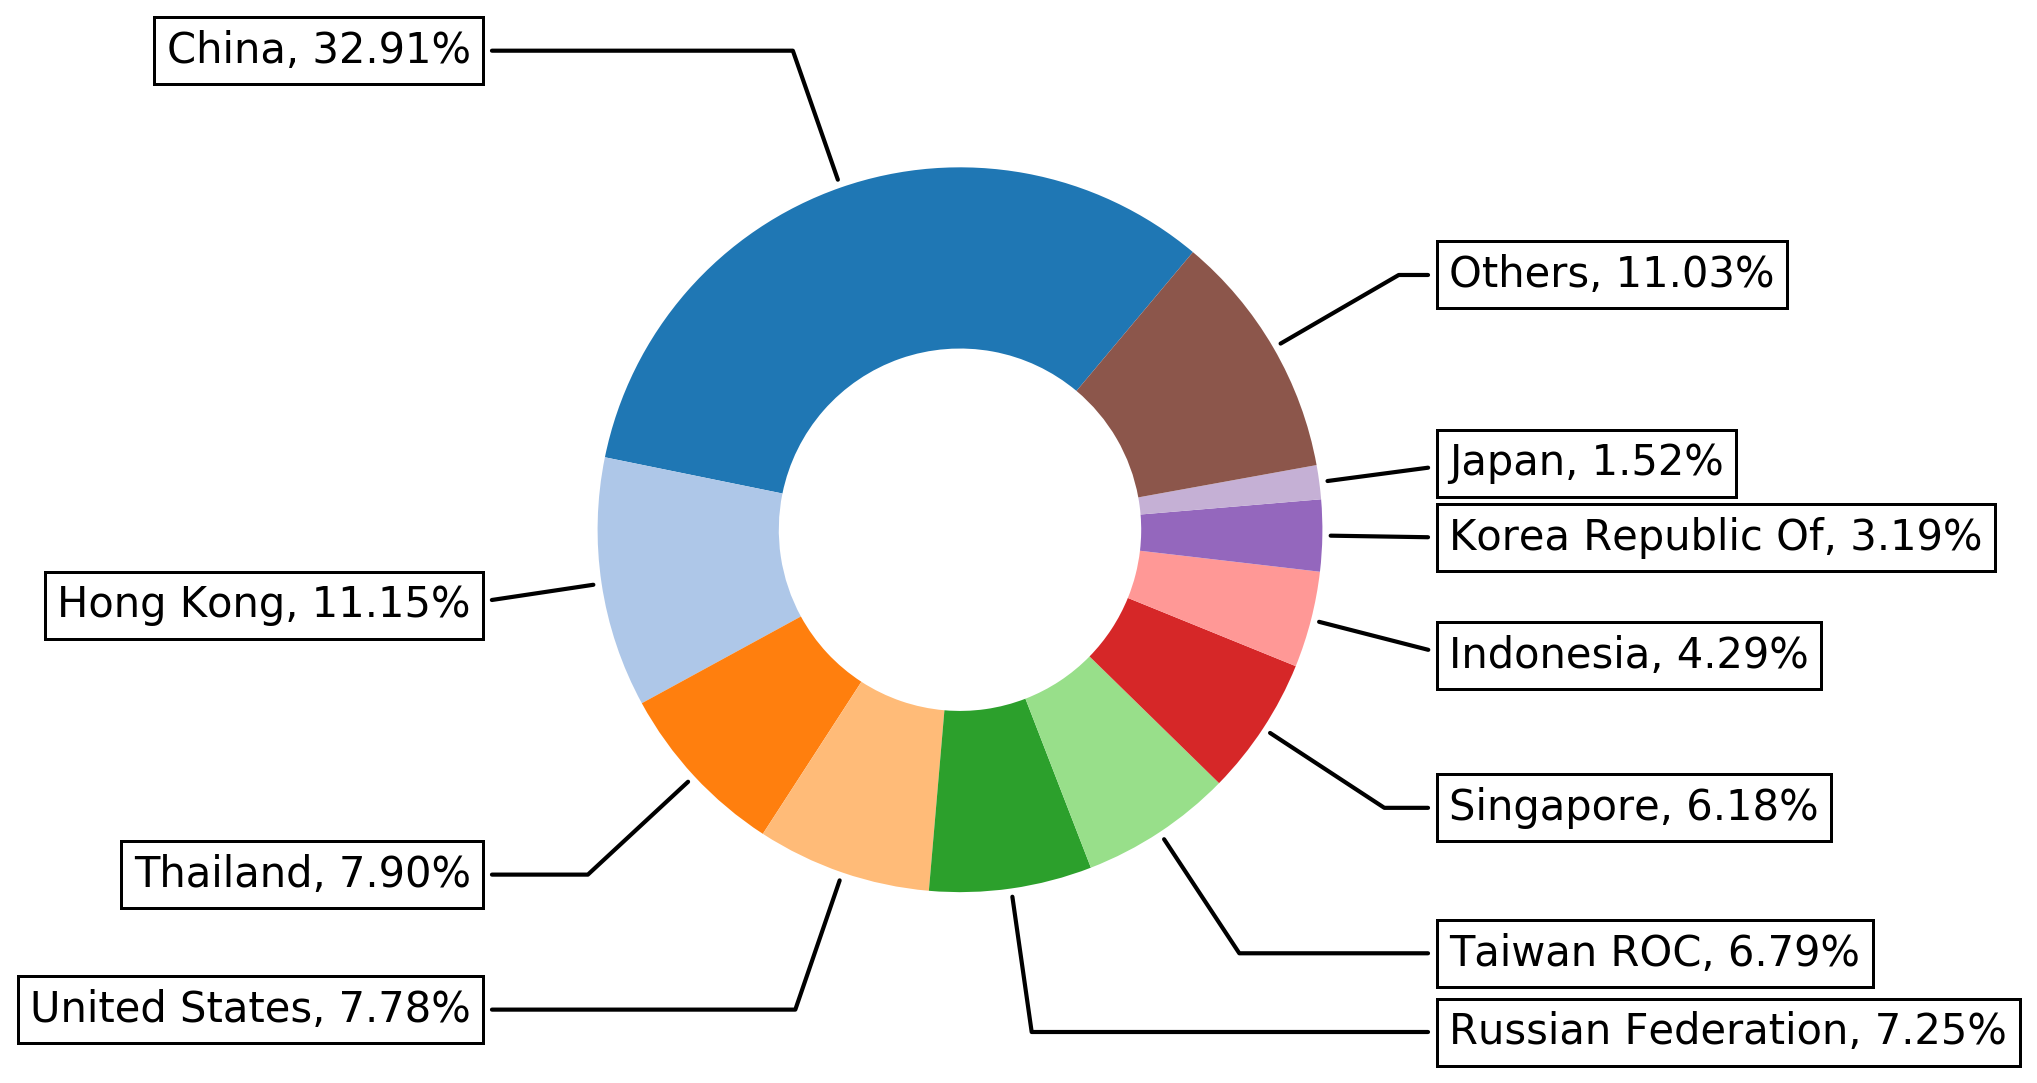
Figure 8 shows the top 10 locations where attacks exploiting CVE-2012-2311 and CVE-2012-1823 come from. Note that the locations shown for attacks in the figure don’t necessarily correspond to the physical location of the attackers. Attackers might use proxy servers and anonymizers to add extra hops to hide their locations.
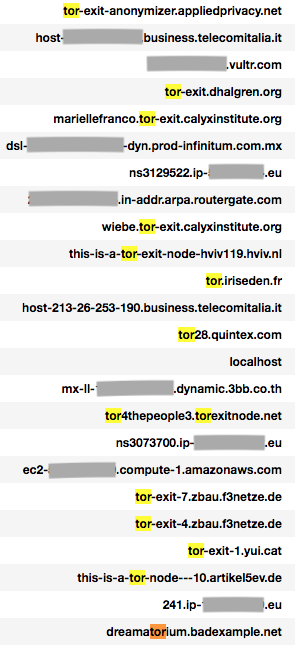
We also looked at the reverse DNS domain analysis on CVE-2012-2311 and CVE-2012-1823 related traffic. We found that Tor IP addresses were used in some of the traffic. In these cases, attackers commonly used Tor to hide source address and geolocation information. It can also be used to evade detection based on IP address/domain blacklisting. Here are some example reverse DNS records from the traffic:
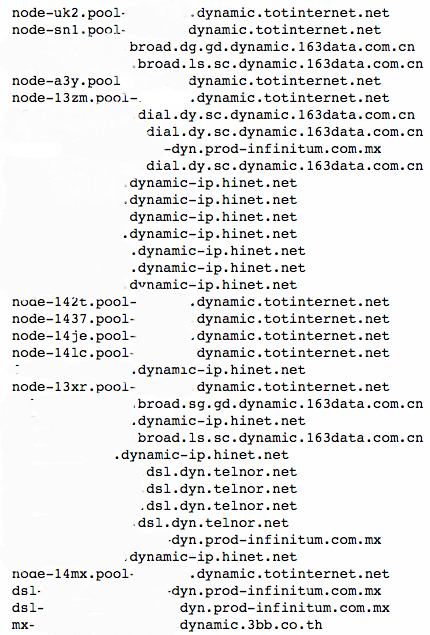
Besides the usage of anonymizer services like Tor, we also found that some source domains belong to dynamic DNS. Dynamic DNS domains are widely used by attackers to evade static detection by generating fast-changing IP-domain mappings. Also, dynamic DNS services are mostly free or cheaper than normal DNS domain names.
We also looked at the traffic to see if there are any typical timing patterns used by attacks exploiting CVE-2012-2311 and CVE-2012-1823. After adjusting the time zone of where attacks were detected to the local time zone where they originated, we can see that Monday was the most common day of activity, while Saturday and Sunday were the least common.
For example, here is a local time analysis on the top three locations (China, Hong Kong and Thailand) from which attacks originated:
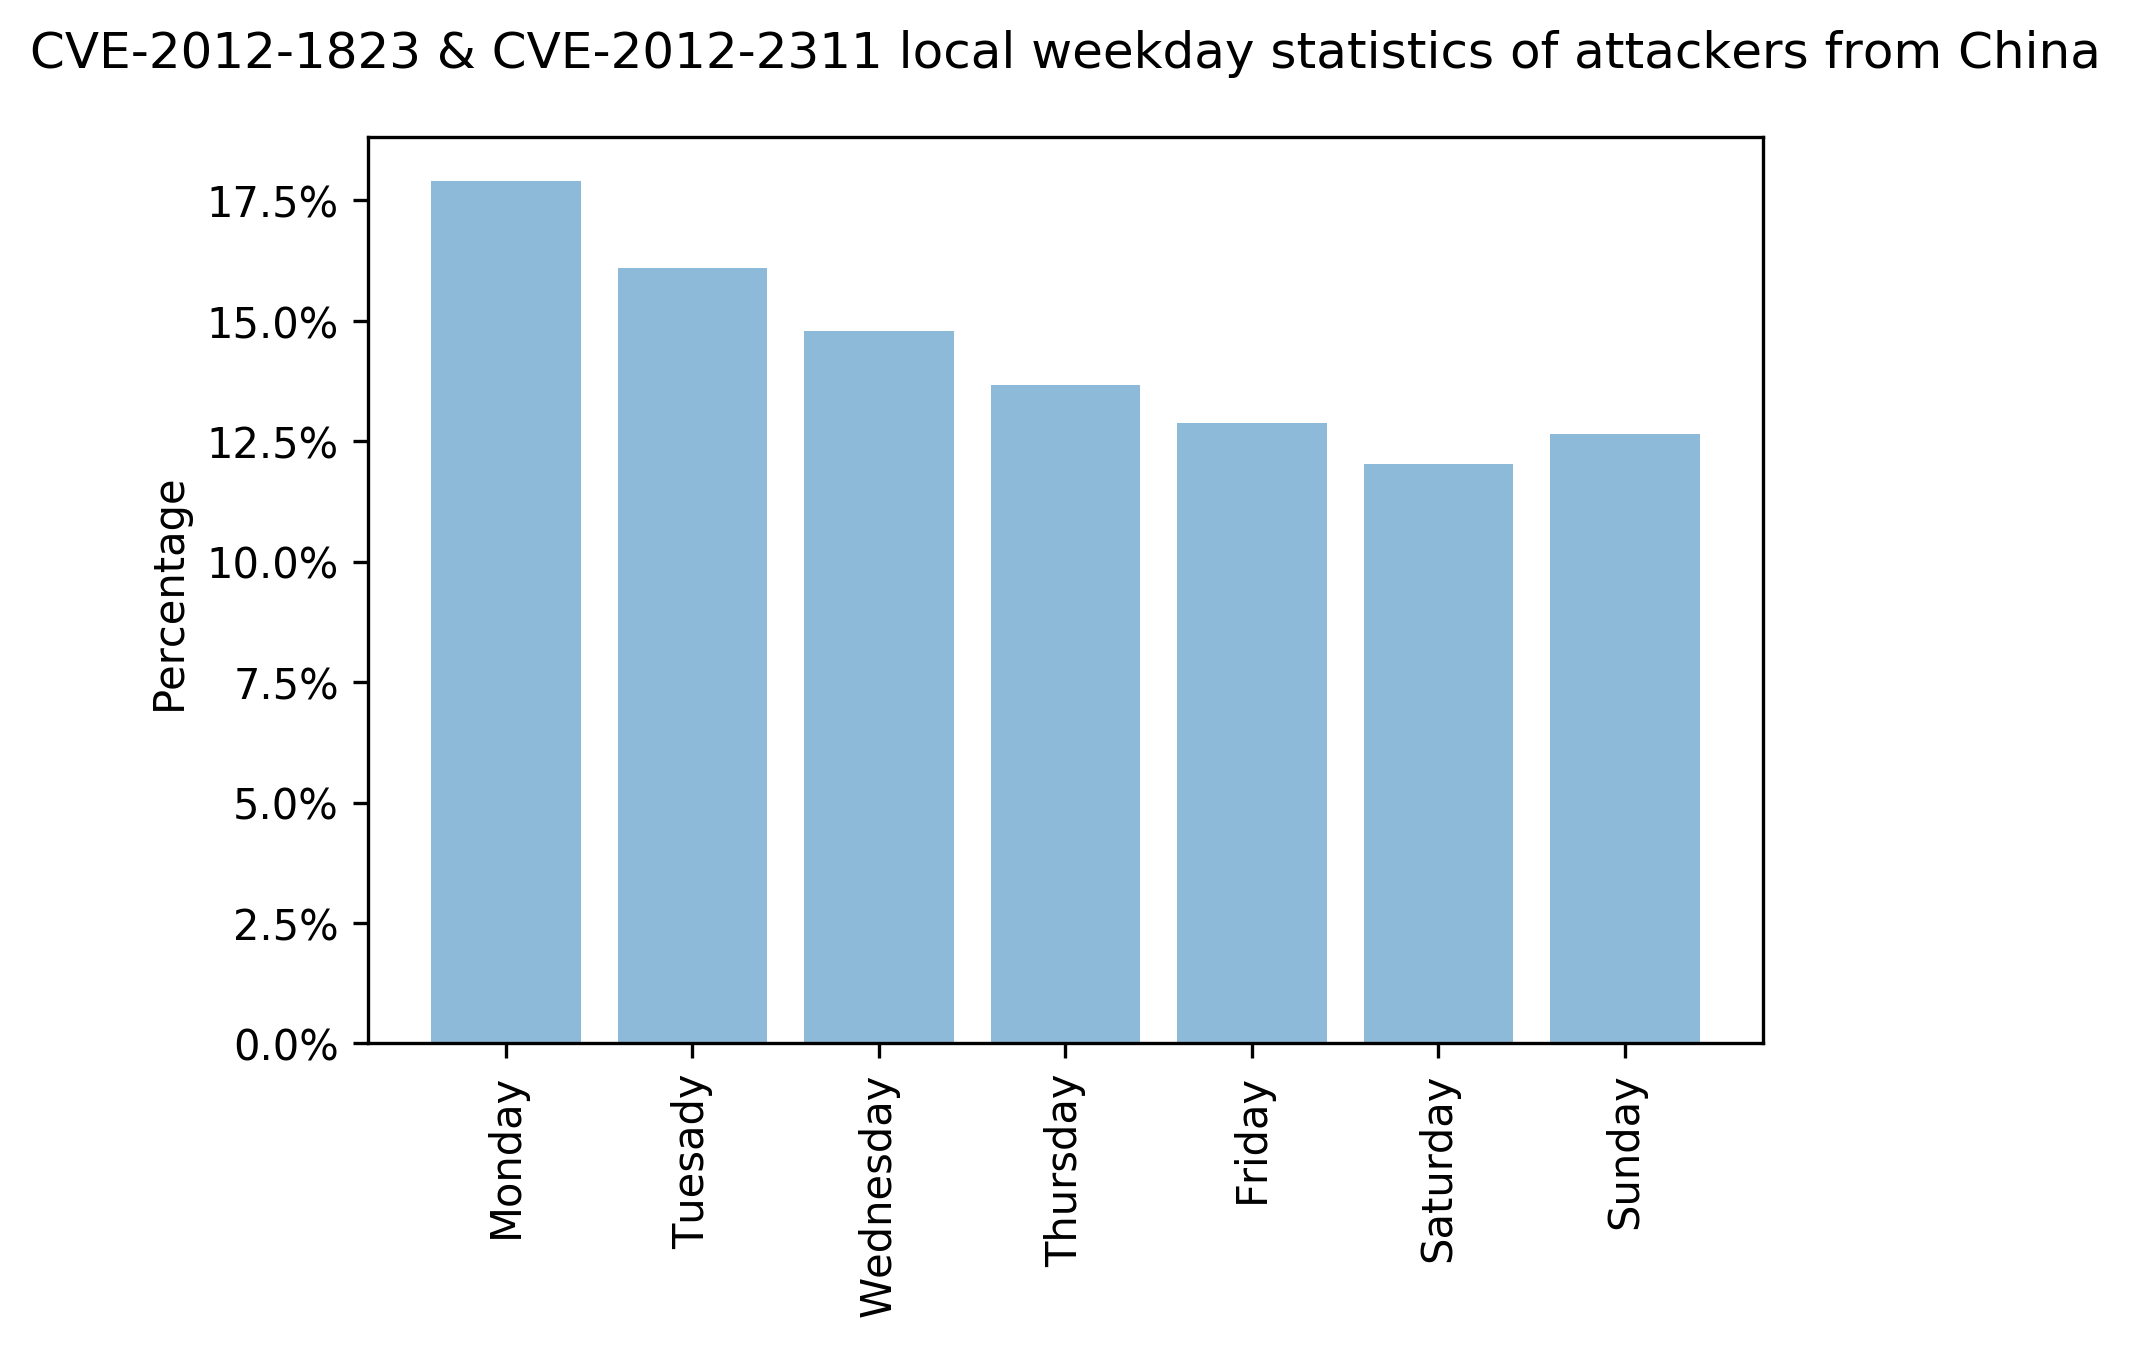
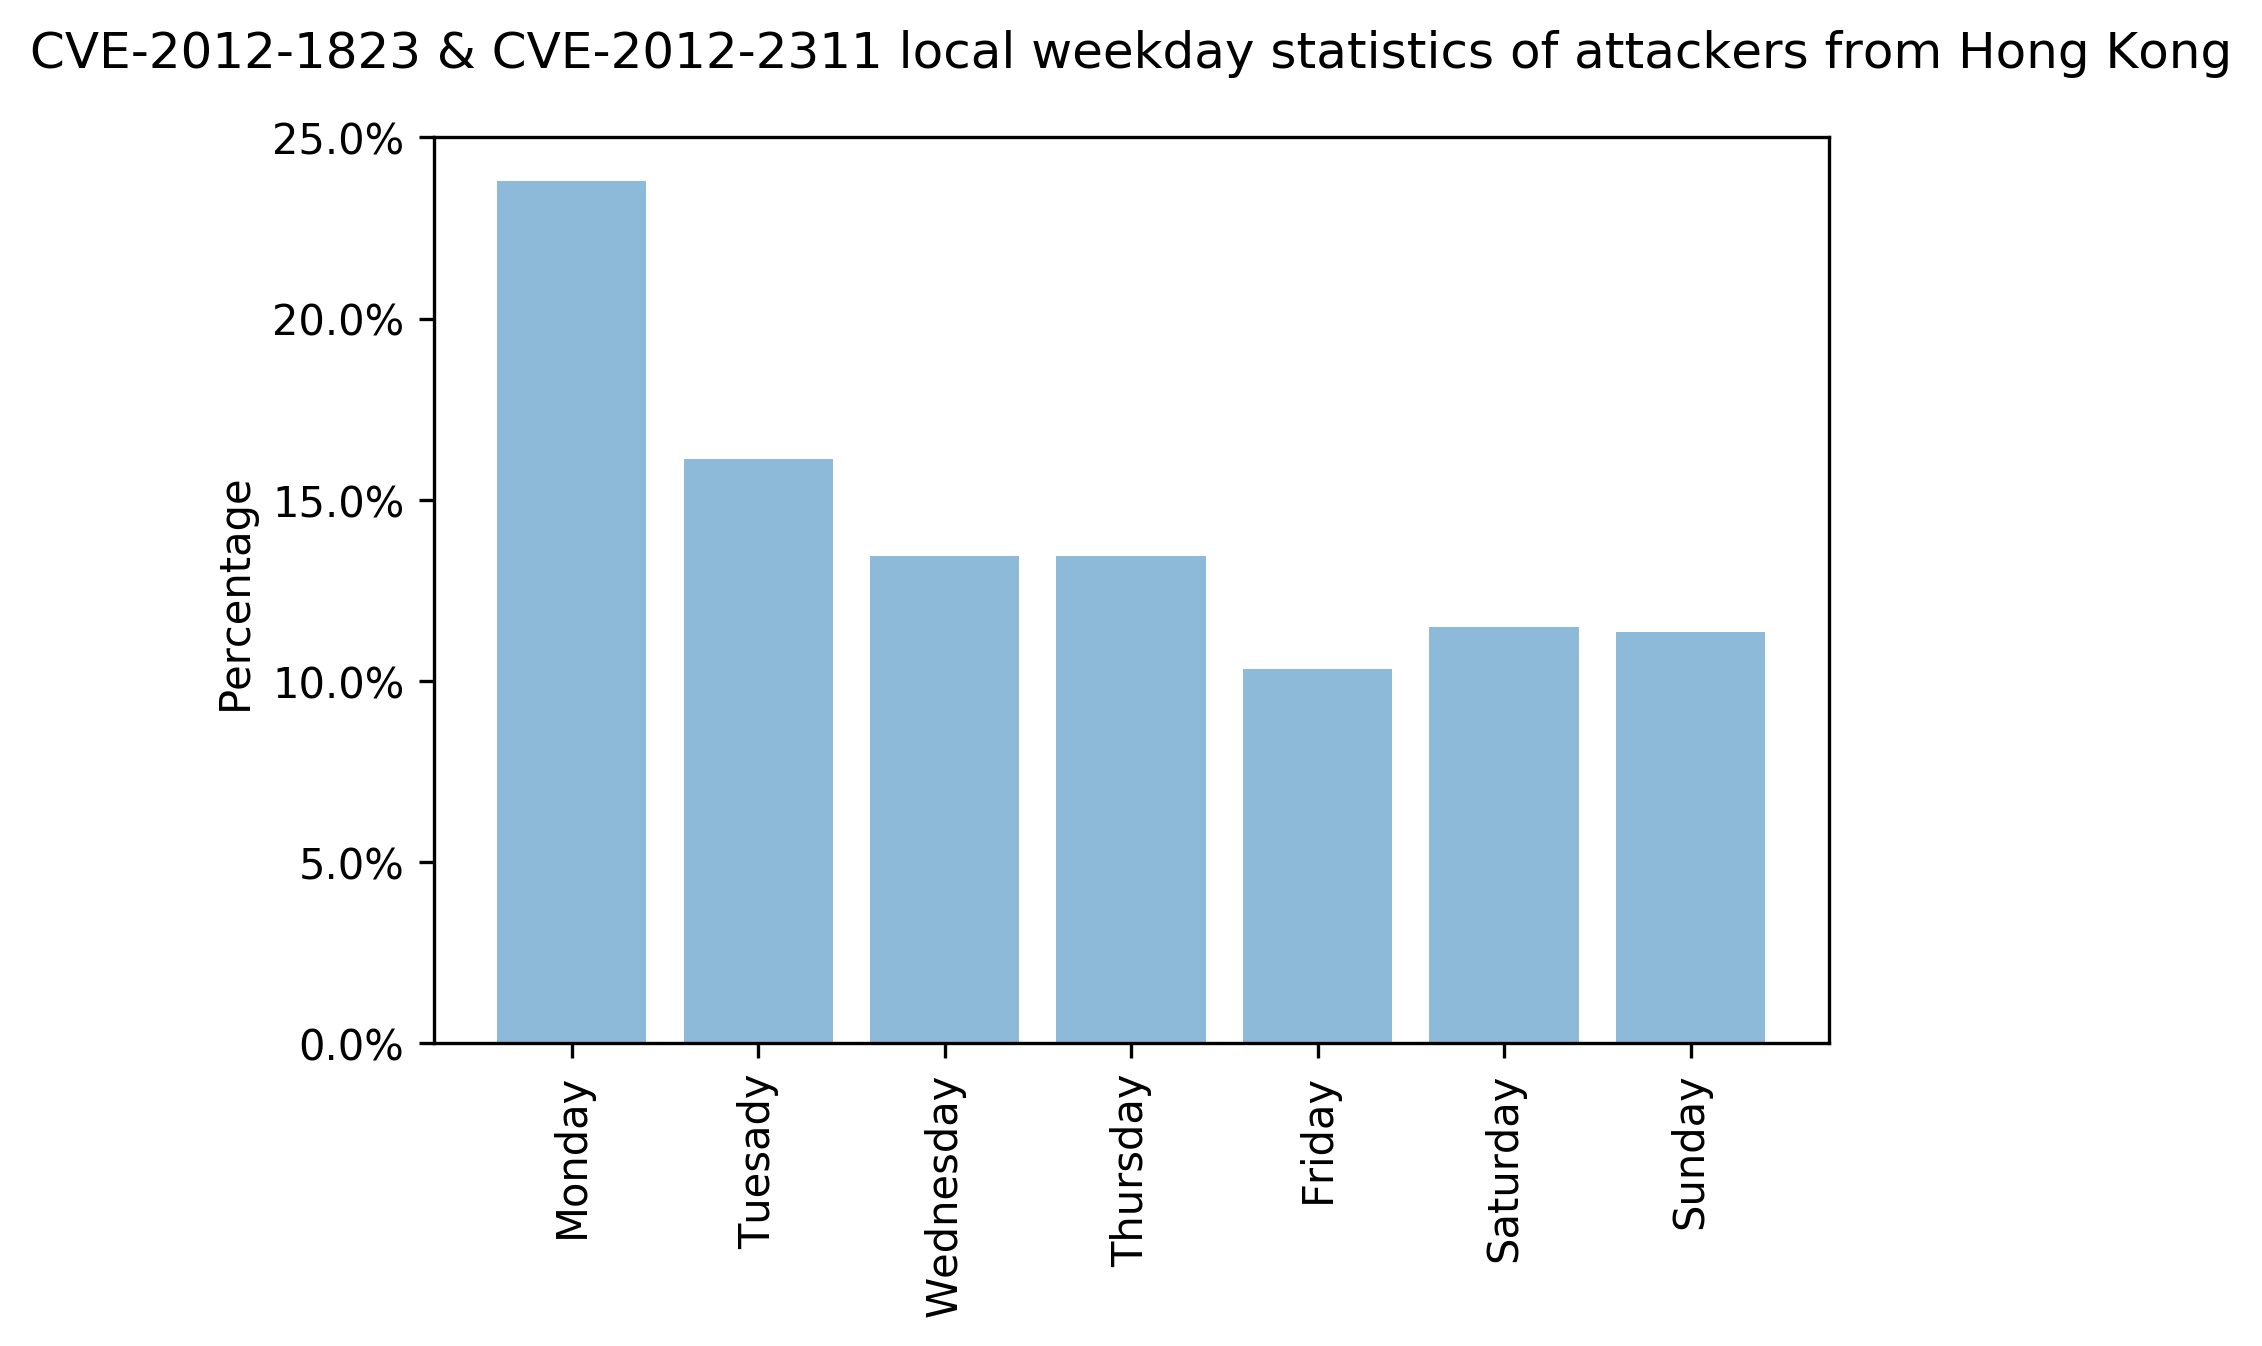
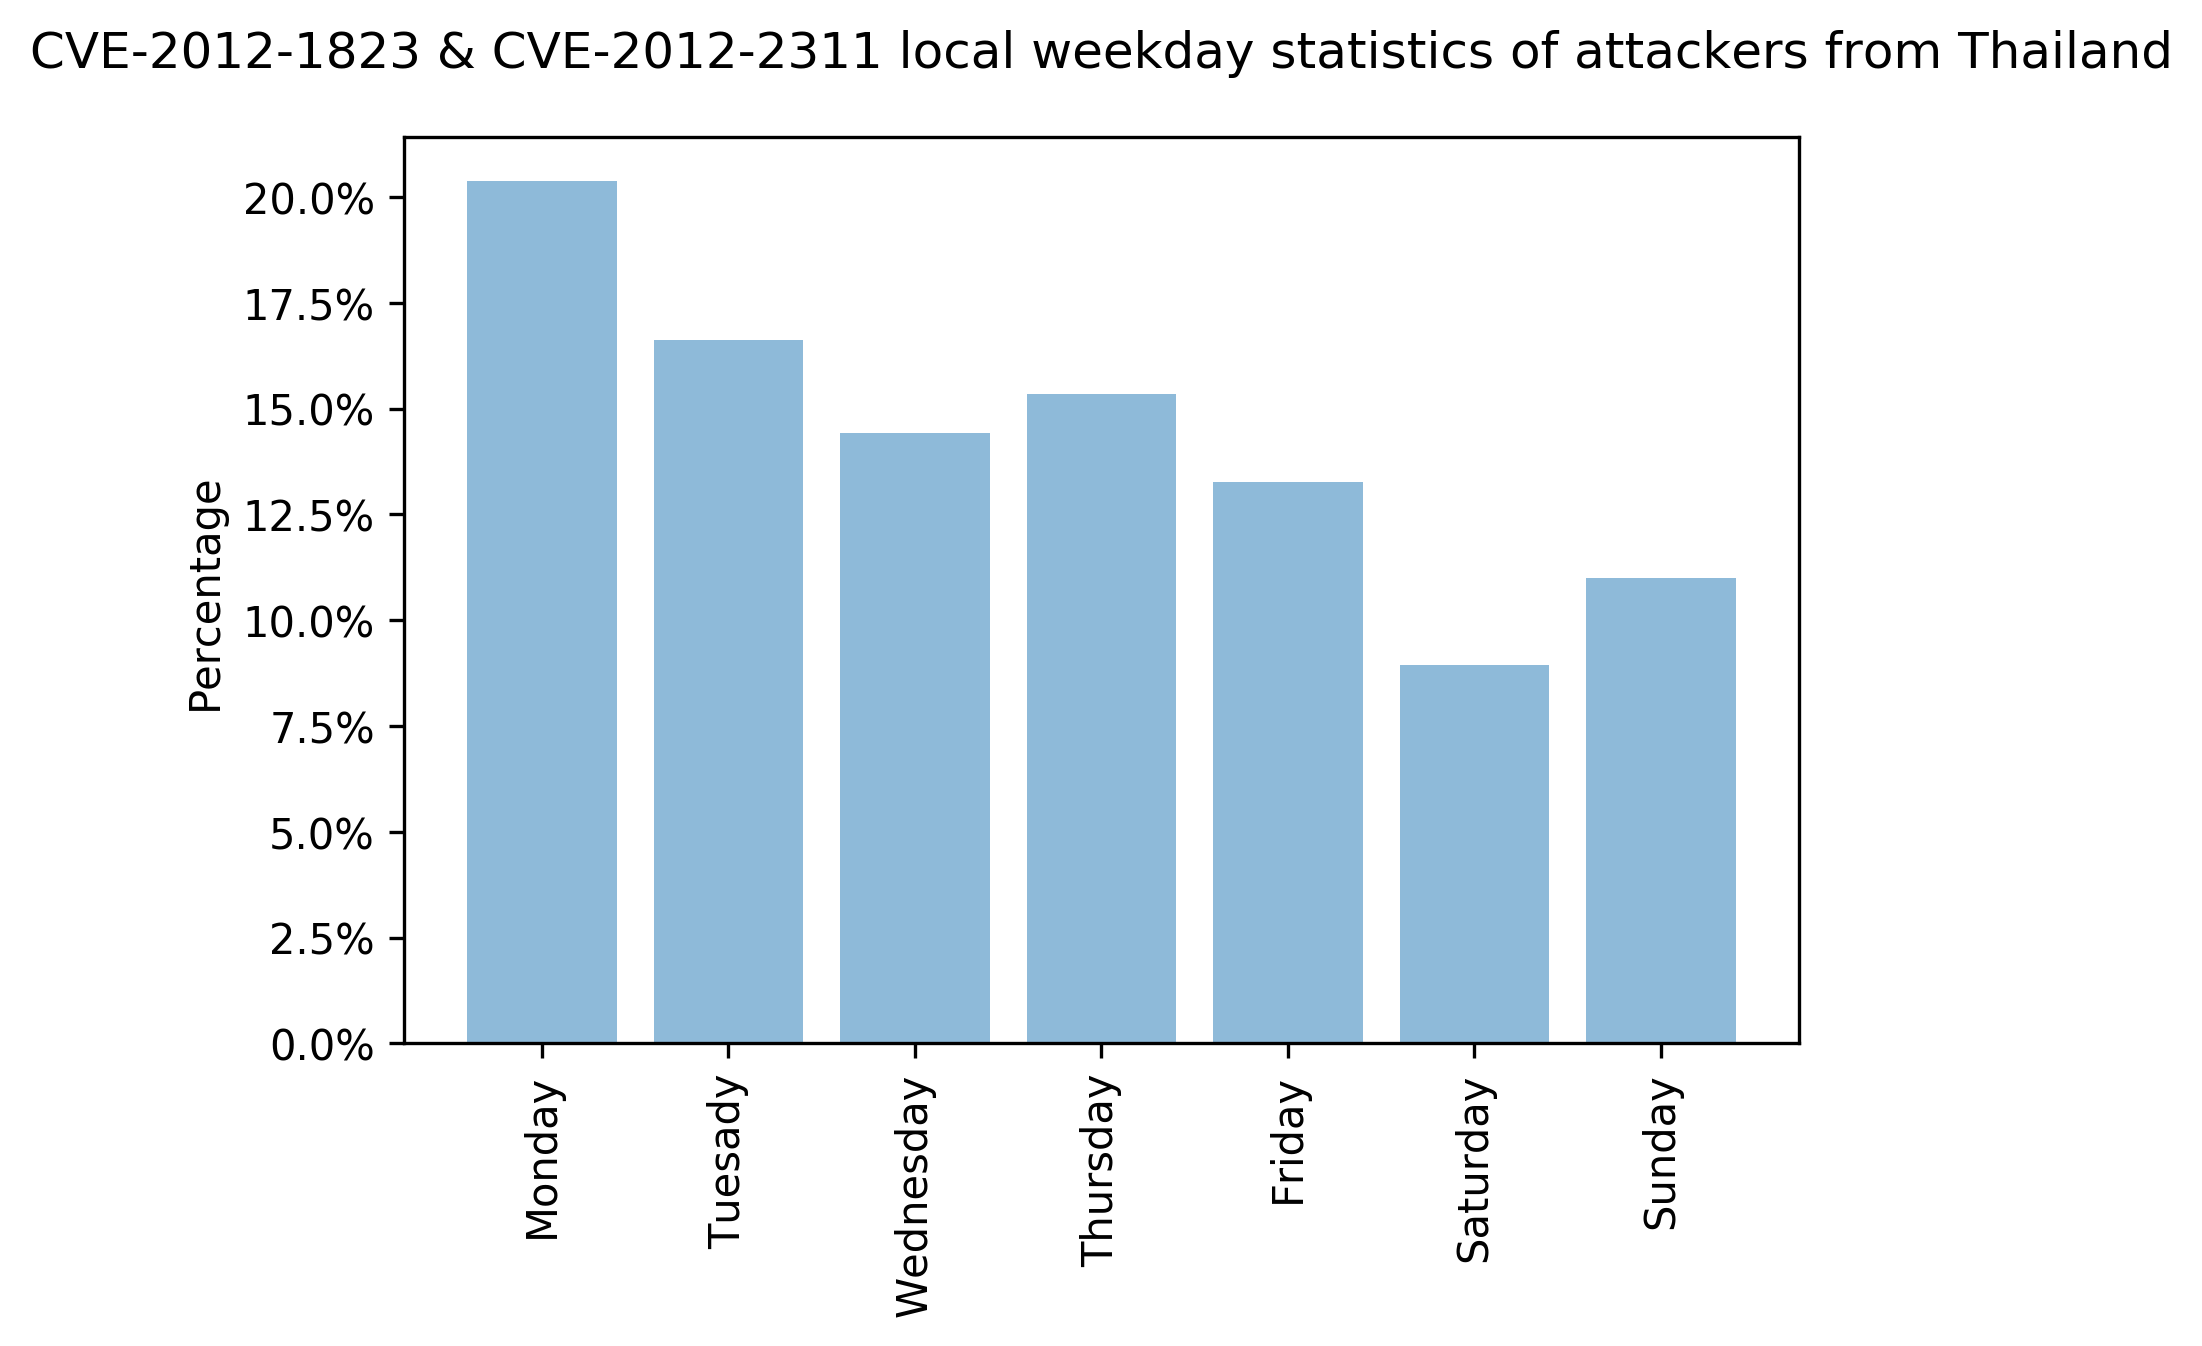
Figures 11-13 show the statistics of attacks exploiting CVE-2012-2311 and CVE-2012-1823 originating from China, Hong Kong and Thailand. We can see that the number of attacks are different across each day of the week. The data shows that Monday tends to have more attacks than the rest of the week.
Conclusion
Taken together, our data shows that attackers clearly prioritize high severity attacks, likely in search of high impact. The most active countries from which attacks originate are China, Russia and the U.S. Though 2012 was eight years ago, some exploits based on vulnerabilities disclosed that year are still active today because it remains feasible to exploit them. This underscores the need for organizations to patch promptly and implement security best practices. Some possible mitigations include:
- Run a Best Practice Assessment to identify where your configuration could be altered to improve your security posture.
- Continuously update your Next-Generation Firewalls with the latest Palo Alto Networks Threat Prevention signatures.
Table of Contents
Related Vulnerabilities Resources


 High Profile Threats