
Executive Summary
Recent August-October 2022 observations of exploits used in the wild reveal that threat actors have been leveraging significant numbers of attacks against the Realtek Jungle SDK remote code execution vulnerability (CVE-2021-35394).
In our observations of network security trends, Unit 42 researchers have pinpointed several attacks based on proof-of-concept (PoC) availability and impact. We have detailed below which of these we believe should be on a defender’s radar.
Other insights that could assist defenders include the following:
- Rankings of the most commonly used attack techniques and the types of vulnerabilities that attackers have recently favored. For example, among 5,190 newly published vulnerabilities, a large portion (almost 9.8%) involves cross-site scripting.
- Lists of major vulnerabilities identified by evaluating more than 232 million attack sessions including remote code execution.
- Insight into how these vulnerabilities are exploited in the wild based on real-world data collected from our Next-Generation Firewalls.
- Summaries of key trends from August-October 2022.
- Analysis of the most recently published vulnerabilities, including the severity and attack origin distribution.
- Classification of these vulnerabilities to provide a clear view of the prevalence of the different types, such as cross-site scripting or SQL injection.
- Lists of the most commonly exploited vulnerabilities attackers are using, as well as the severity, category and origin of each attack.
Palo Alto Networks customers receive protections from the vulnerabilities discussed here through the Next-Generation Firewall and associated Cloud-Delivered Security Services including Threat Prevention, WildFire and Advanced URL Filtering. Protections are also available from Prisma Cloud’s Web Application and API Security (WAAS) and Cortex XDR.
| Types of Attacks and Vulnerabilities Covered | Cross-site scripting, denial of service, information disclosure, buffer overflow, privilege escalation, memory corruption, code execution, SQL injection, out-of-bounds read, traversal, command injection, improper authentication, arbitrary file download, security feature bypass |
| Related Unit 42 Topics | Network Security Trends, exploits in the wild, attack analysis |
Analysis of Published Vulnerabilities, August-October 2022
From August-October 2022, a total of 5,190 new Common Vulnerabilities and Exposures (CVE) numbers were registered. To better understand the potential impact these newly published vulnerabilities could have on network security, we provide our observations based on the severity, availability of working proof-of-concept (PoC) code, and vulnerability categories.
How Severe Are the Latest Vulnerabilities?
To estimate the potential impact of vulnerabilities, we consider their severity and examine any reliable PoCs available that attackers could easily launch. Some of the public sources we use to find PoCs are Exploit-DB, GitHub and Metasploit. Distribution of the 5,190 CVEs that have an assigned severity score of medium or higher can be seen in the following table:
| Severity | Count | Ratio | Ratio Change From Last Quarter % | PoC Availability | Change in PoC Availability |
| Critical | 980 | 18.9% | -0.1% | 2.9% | -2.6% |
| High | 2184 | 42.1% | +2.0% | 2.2% | -1.6% |
| Medium | 2026 | 39.0% | -1.9% | 2.3% | -1.1% |
Table 1. Severity distribution for CVEs registered August-October 2022, including only those rated medium to critical.
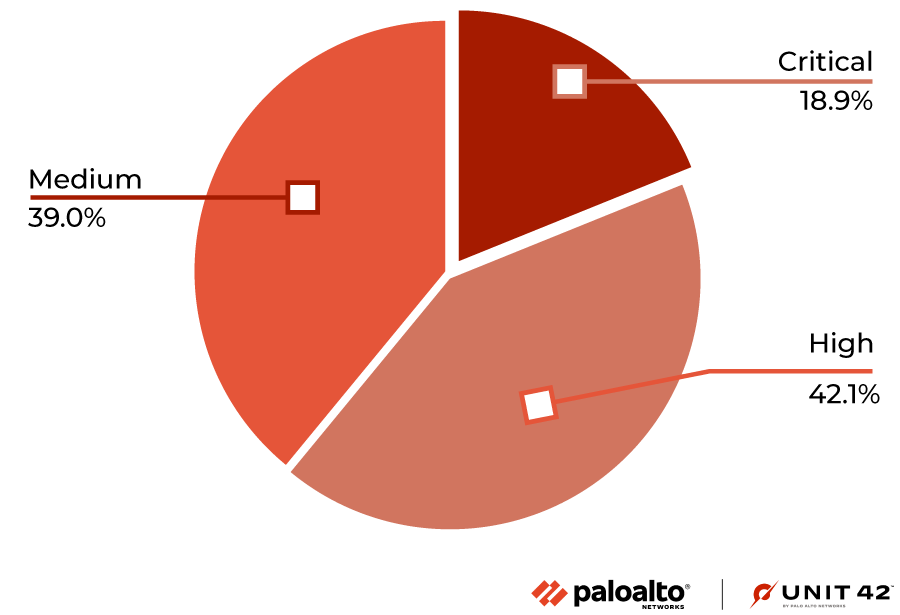
Our classification of vulnerability levels is based on CVSS v3 scores. Many conditions must be met to rate a vulnerability as critical, so there are very few at this level. One of the common factors for rating a vulnerability at this level is whether it has a working PoC available. To be considered critical, vulnerabilities generally have low attack complexity, and it is often easy to create a PoC to exploit them.
In the period we discuss here, PoC ratios decreased slightly for all severity levels.
Vulnerability Category Distribution
It is crucial to understand each type of vulnerability and its consequences. Out of the newly published CVEs that were analyzed, 26.6% are classified as local vulnerabilities, requiring prior access to compromised systems, while the remaining 73.4% are remote vulnerabilities, which can be exploited over a network. This means that most newly published vulnerabilities introduce potential opportunities for threat actors to attack vulnerable organizations from anywhere in the world.
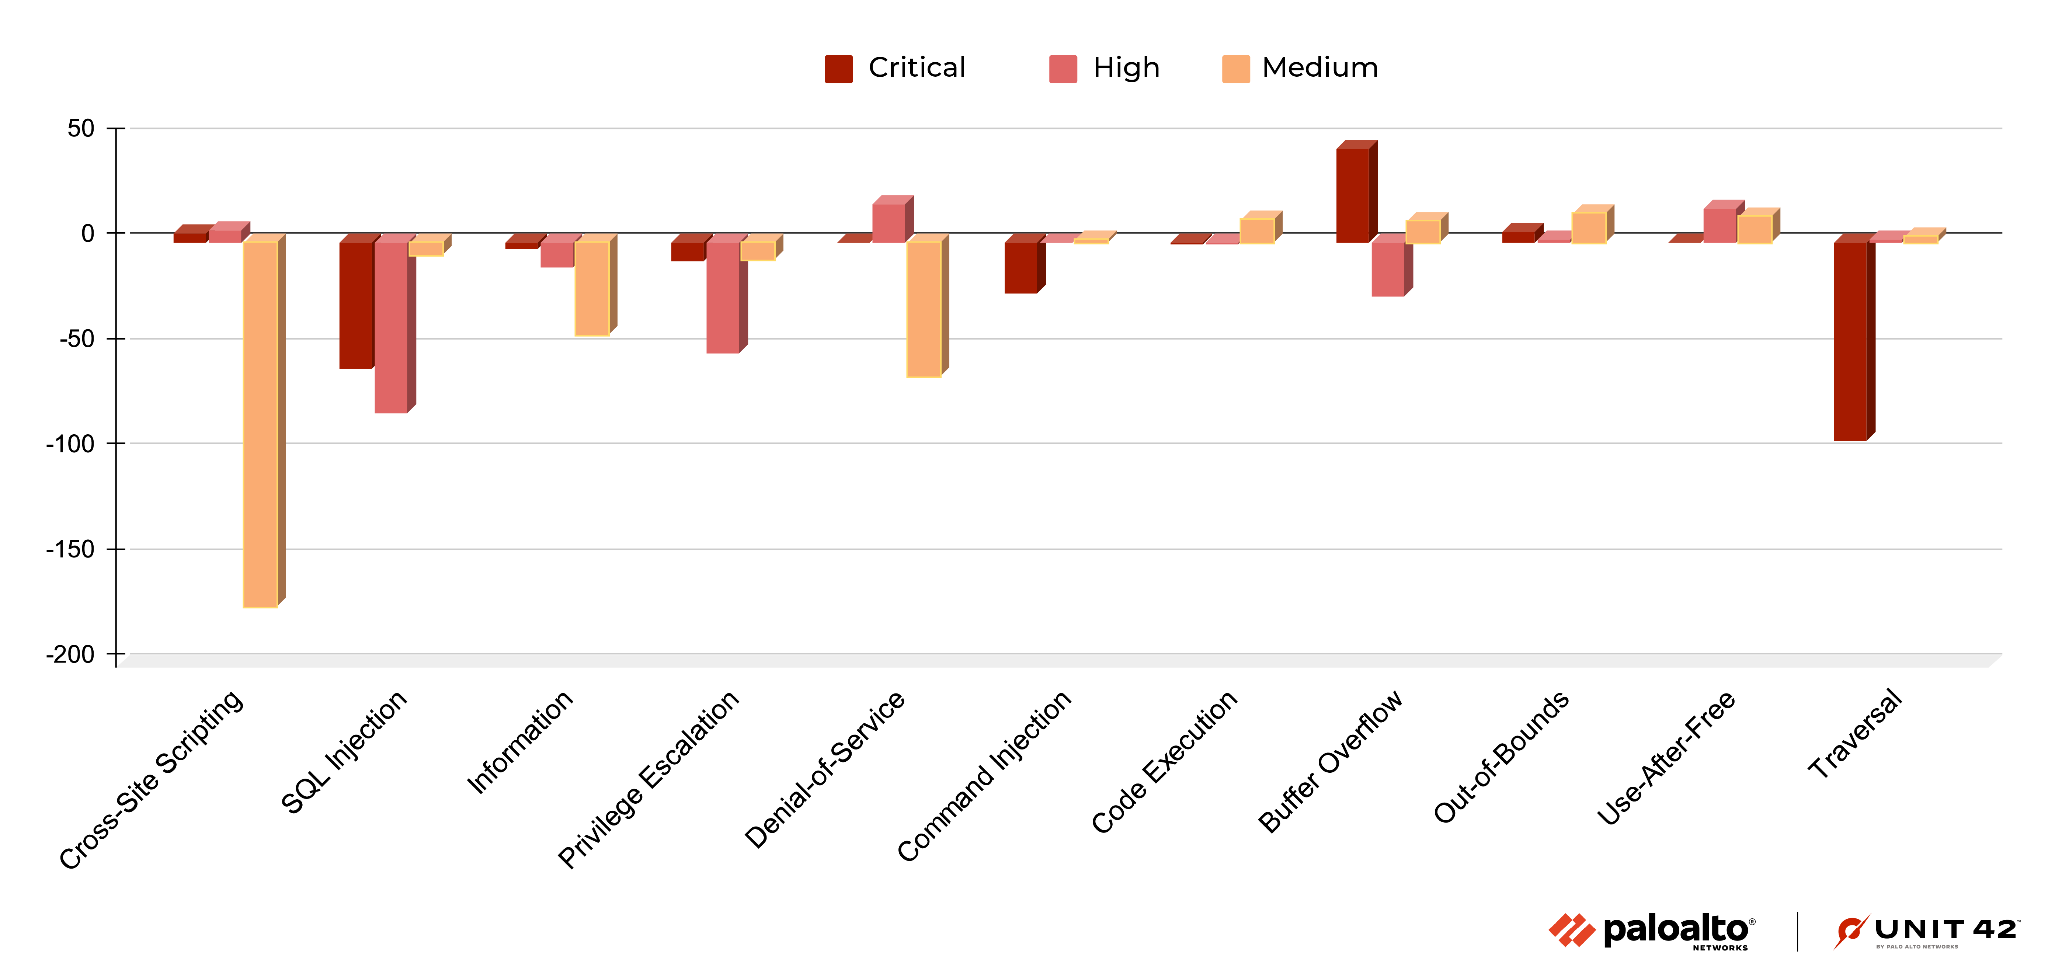
In Figure 2, the most common vulnerability types are ranked by how prevalent they were among the most recent set of published vulnerabilities.
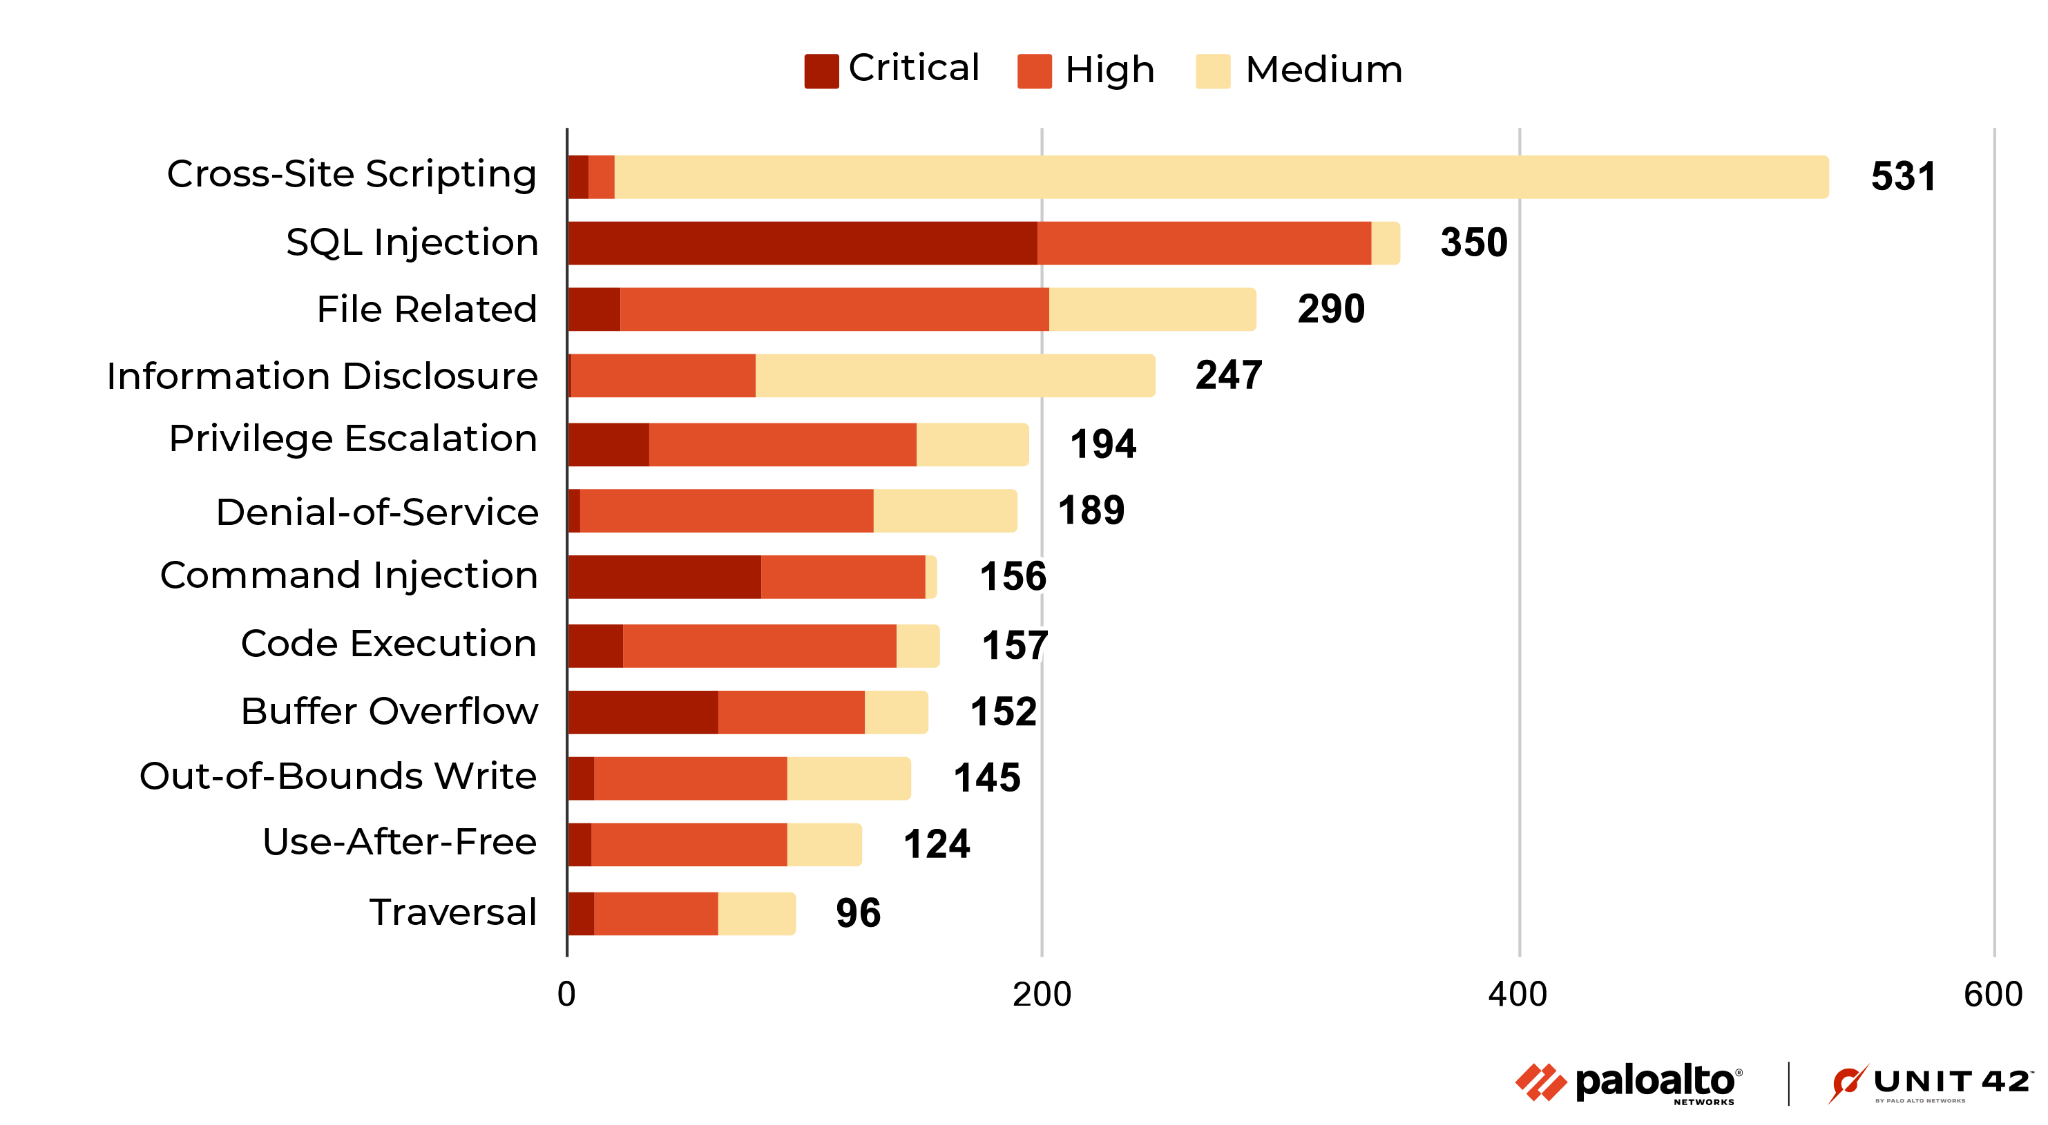
Cross-site scripting remains the most reported vulnerability during August-October 2022. We also saw that the prevalence of buffer overflow vulnerabilities increased during this time. The number of new vulnerabilities of other types, such as cross-site scripting and denial-of-service, has decreased. Most of the recently published cross-site scripting and information disclosure vulnerabilities are usually at medium or high severity (rather than critical).
Network Security Trends: Analysis of Exploits in the Wild, August-October 2022
Data Collection
By leveraging Palo Alto Networks Next-Generation Firewalls as sensors on the perimeter, Unit 42 researchers observed malicious activities from August-October 2022. The malicious traffic we identified is further processed and based on metrics such as IP addresses, port numbers and timestamps. This ensures the uniqueness of each attack session and thus eliminates potential data skews. We analyzed 232 million valid malicious sessions and then correlated the refined data with other attributes to infer attack trends over time to get a picture of the threat landscape.
How Severe Were the Attacks Exploited in the Wild?
To arrive at 232 million valid malicious sessions, we excluded the original set of low-severity signature triggers used to detect scanning and brute-force attacks, as well as internal triggers used for research purposes. Therefore, we consider exploitable vulnerabilities with a medium and higher severity ranking (based on the CVSS v3 Score) as a verified attack.
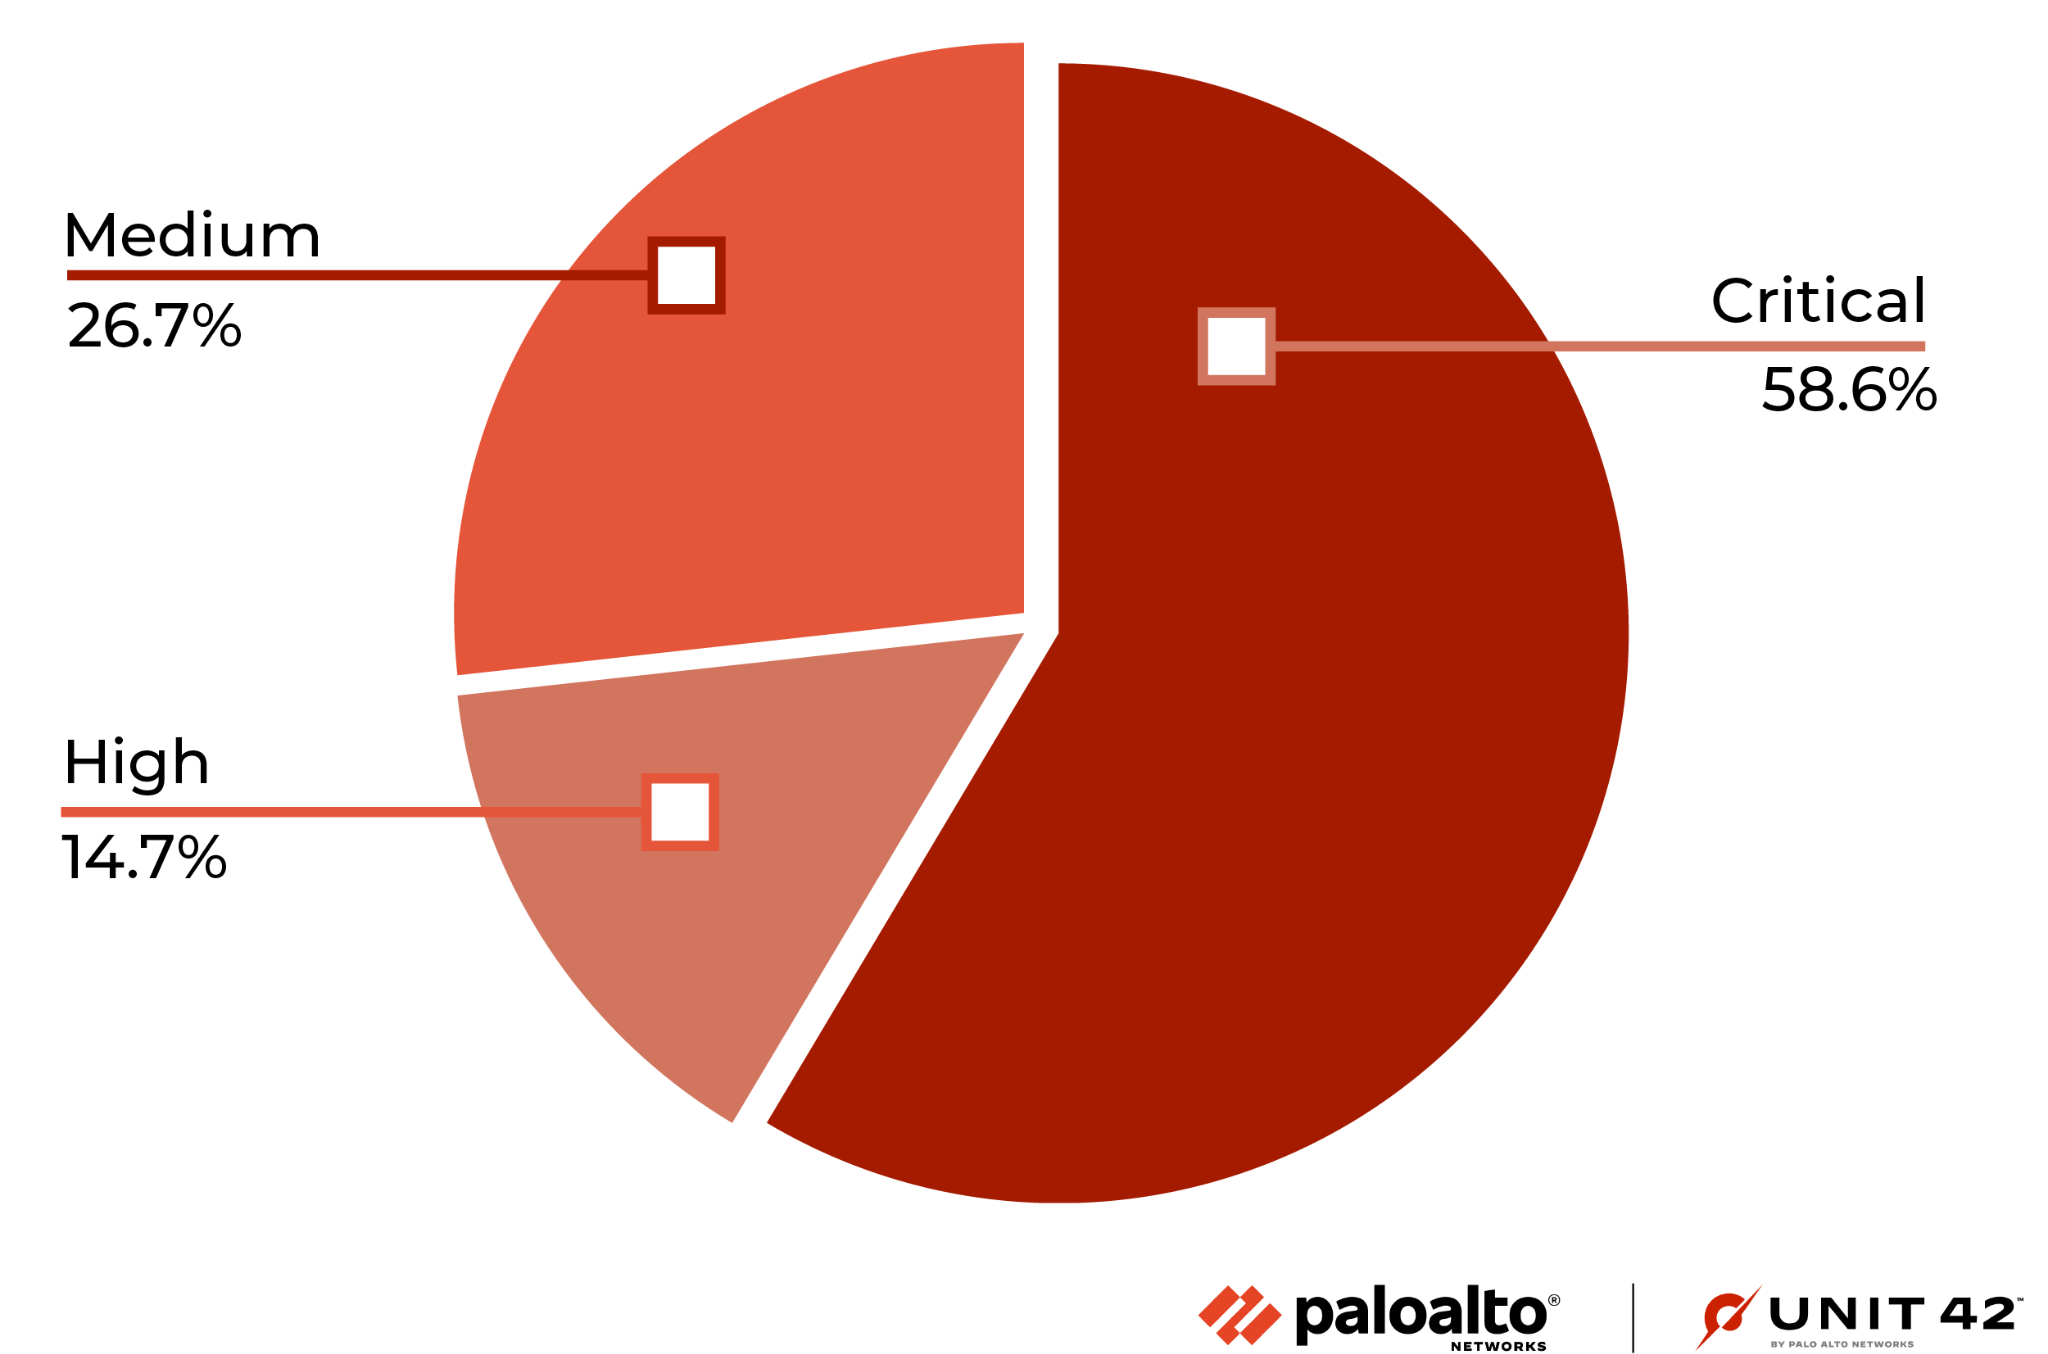
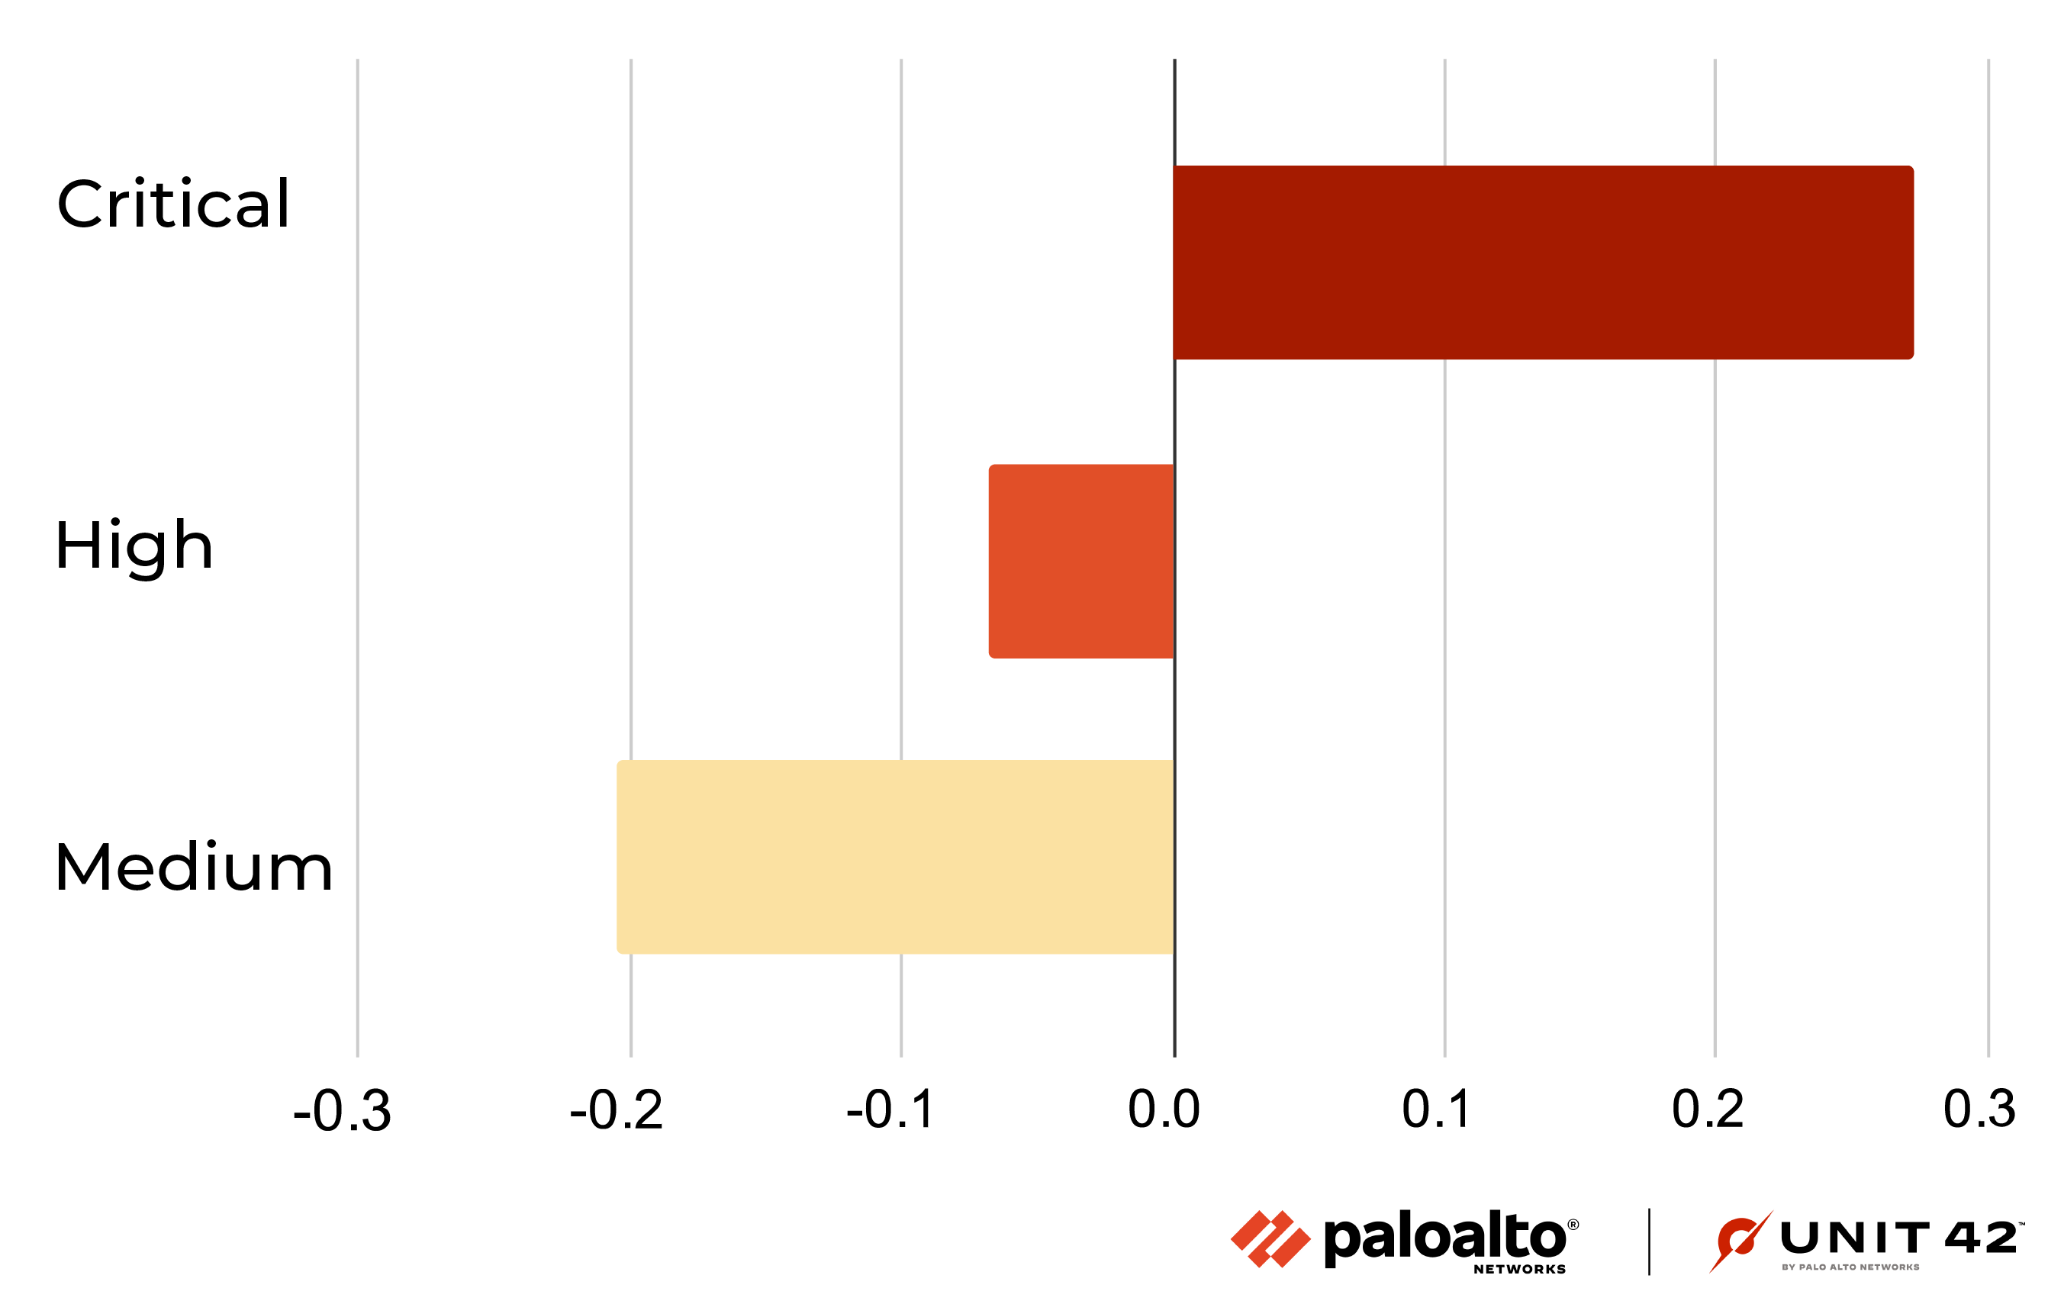
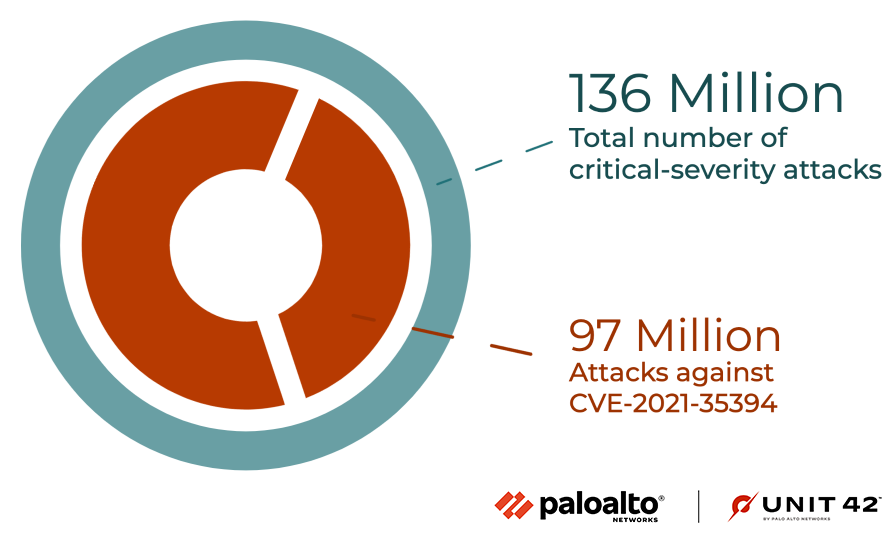
Figure 4 shows the ratio of attacks grouped by the severity of each vulnerability. Compared with the previous quarters' severity distribution, this quarter shows an increase in critical attacks. We further analyzed the data and found that the attacks against the Realtek Jungle SDK remote code execution vulnerability (CVE-2021-35394) accounted for 71.4% of all critical attacks, accounting for 41.8% of the total number of attacks.
When Did the Network Attacks Occur?
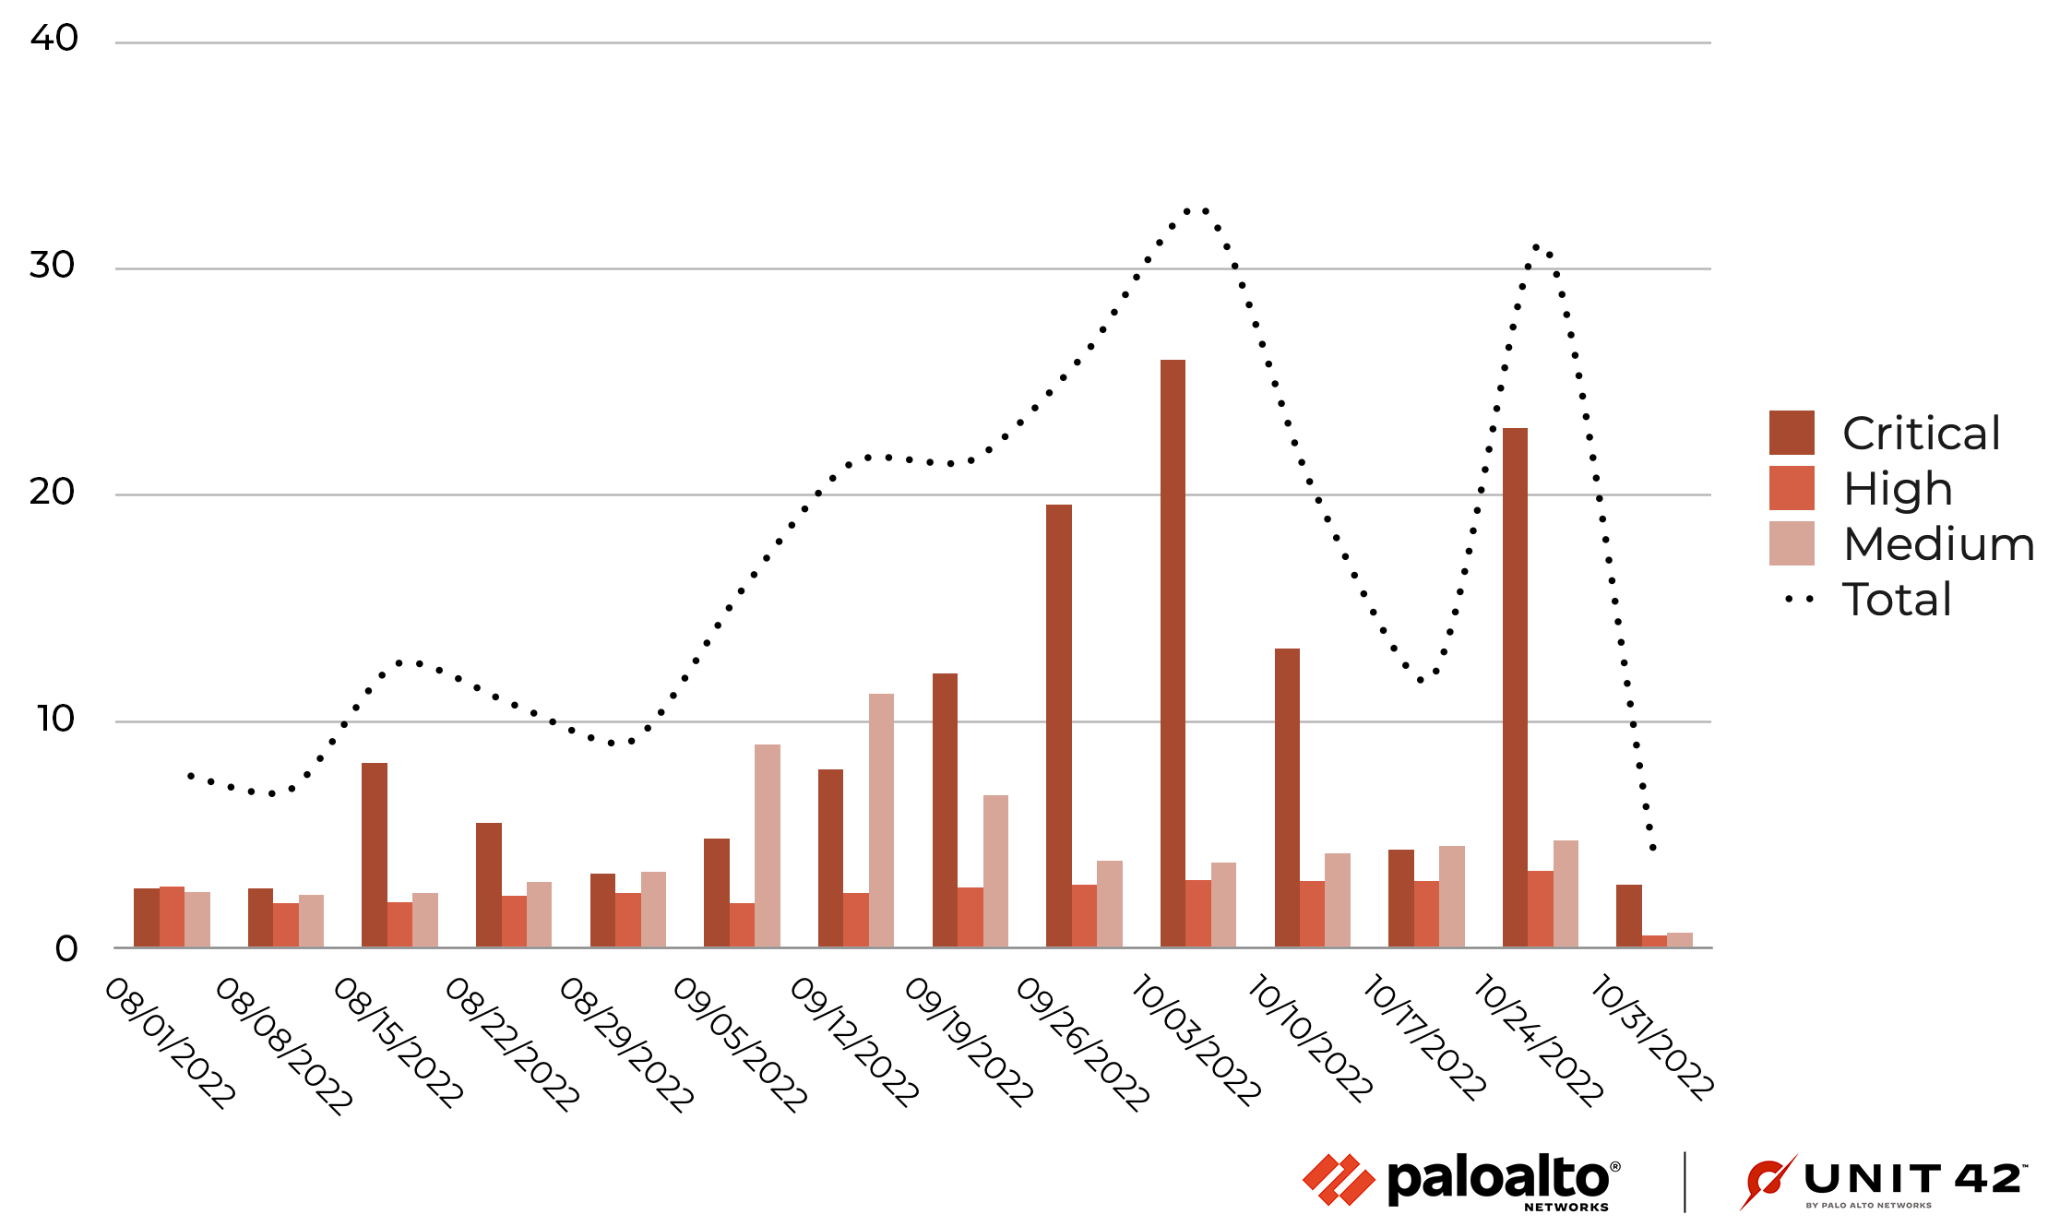
During August-October 2022, there has been a spike in critical attacks over several weeks, most likely related to the increase in attacks referenced in the previous section, and a slight increase in attacks exploiting medium-severity vulnerabilities in September. There were no significant fluctuations in the number of attacks of other severities at other times.
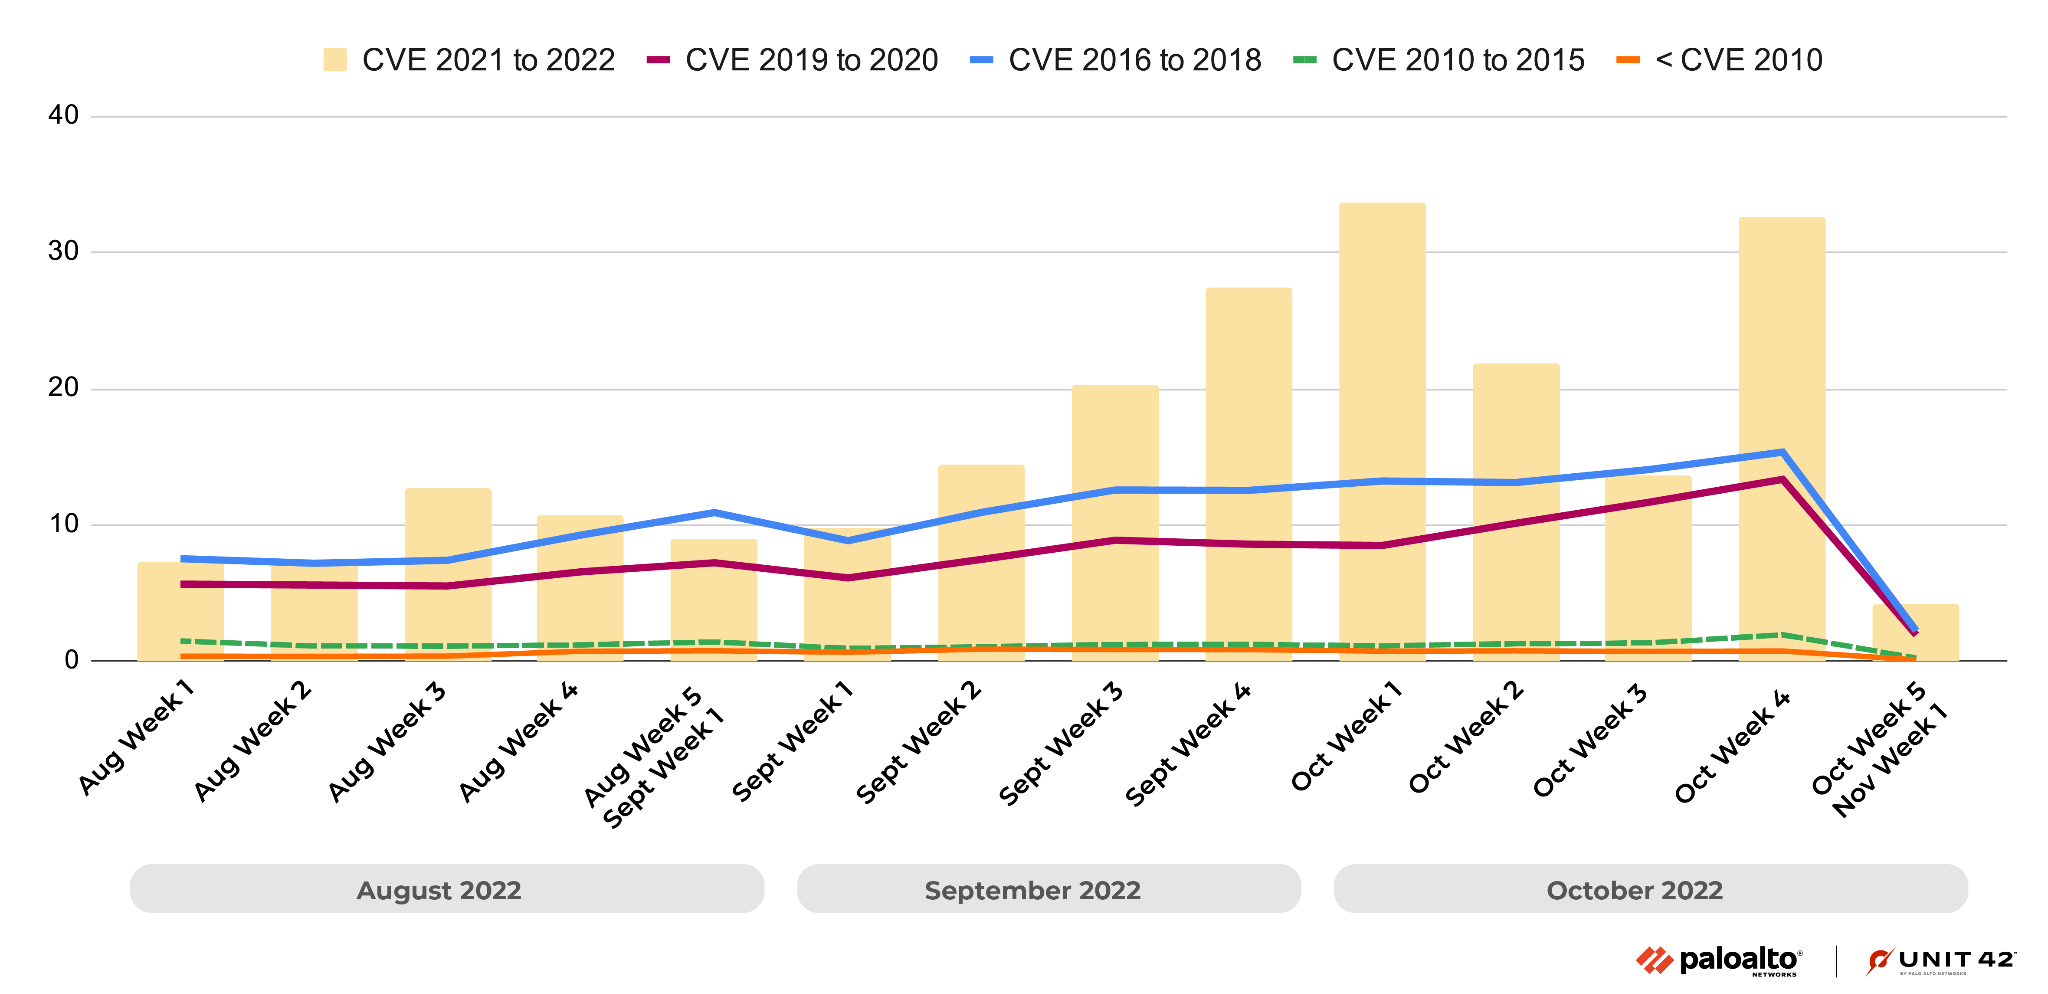
As we’ve seen in the past, attackers frequently use recently disclosed vulnerabilities, especially those from 2021-2022. This shows the importance of updating security products and applying software patches as soon as they become available to protect against the most recently discovered vulnerabilities. Due to the extremely large number of attacks exploiting the Realtek Jungle SDK remote code execution vulnerability (CVE-2021-35394), the distribution of CVE numbers in attacks in the wild this quarter has been dramatically different from that of previous quarters.
Attack Category Distribution
We classified each network attack by category and organized them in terms of prevalence. In the period discussed, remote code execution ranks first, followed by traversal.
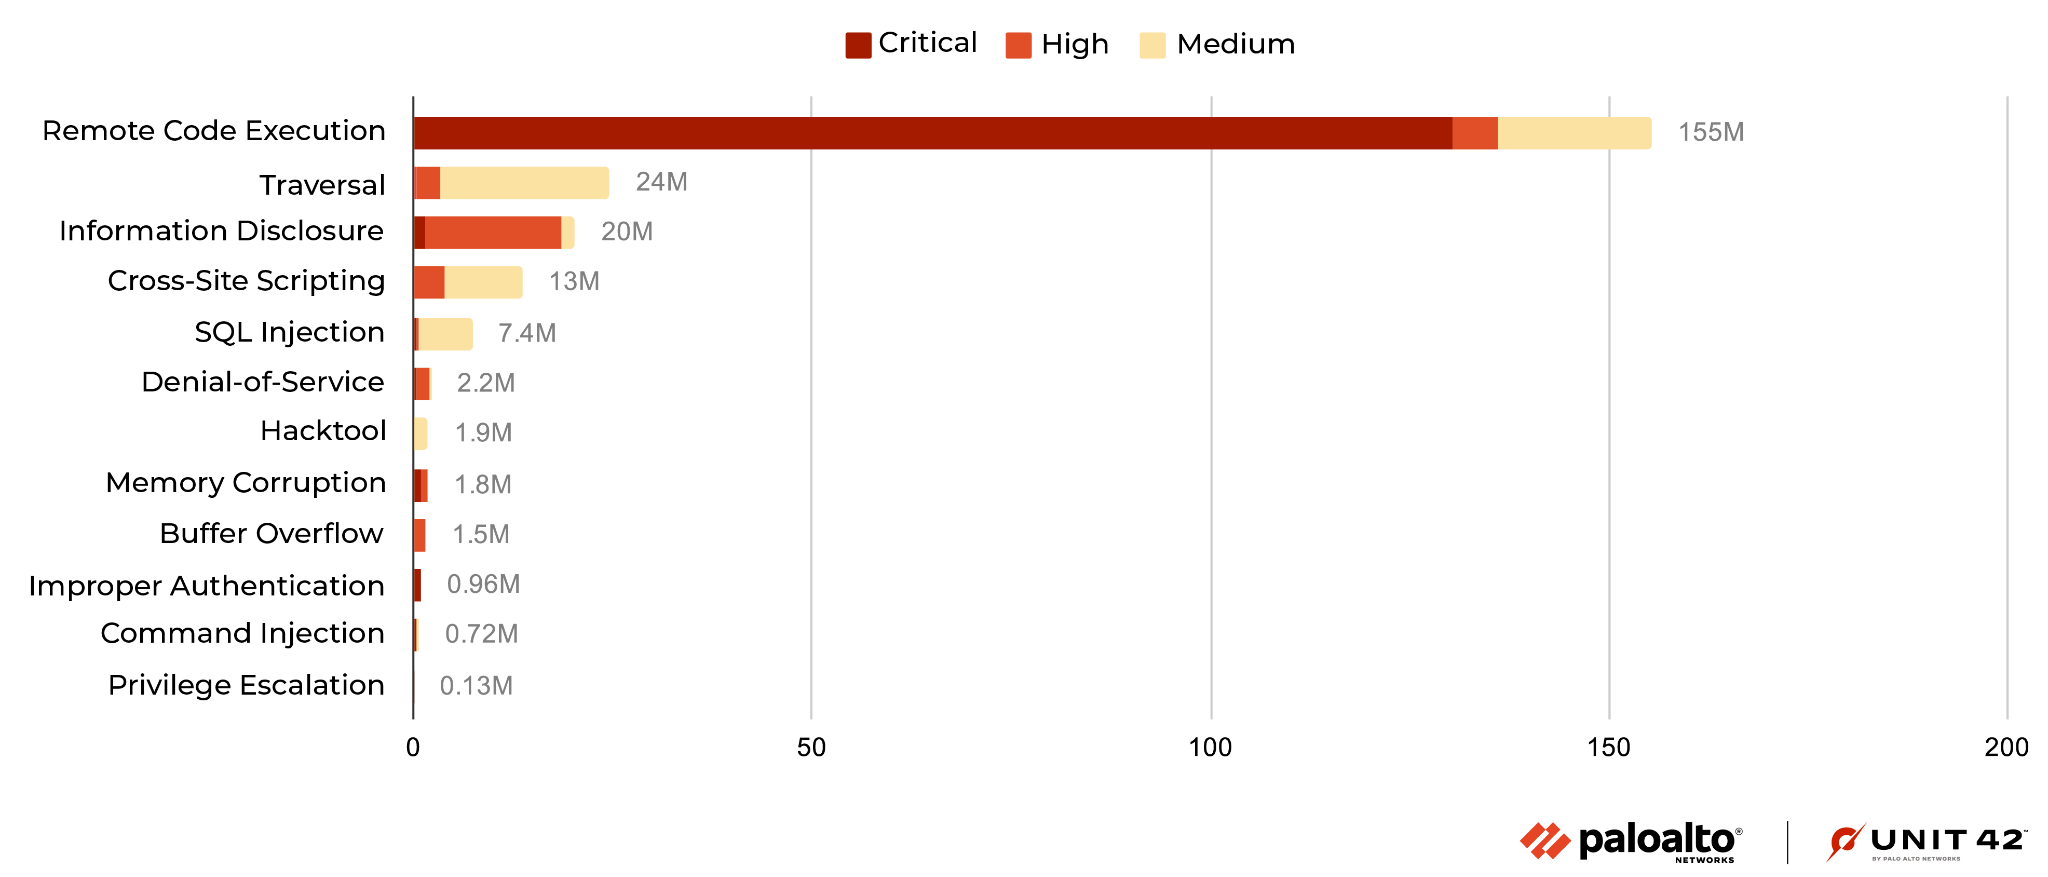
Compared with the previous quarter, due to the aforementioned Realtek Jungle SDK remote code execution vulnerability being greatly exploited, this quarter's remote code execution increased sharply. In addition, traversal rose almost double compared to the previous quarter, and information disclosure fell by almost a third of the previous quarter.
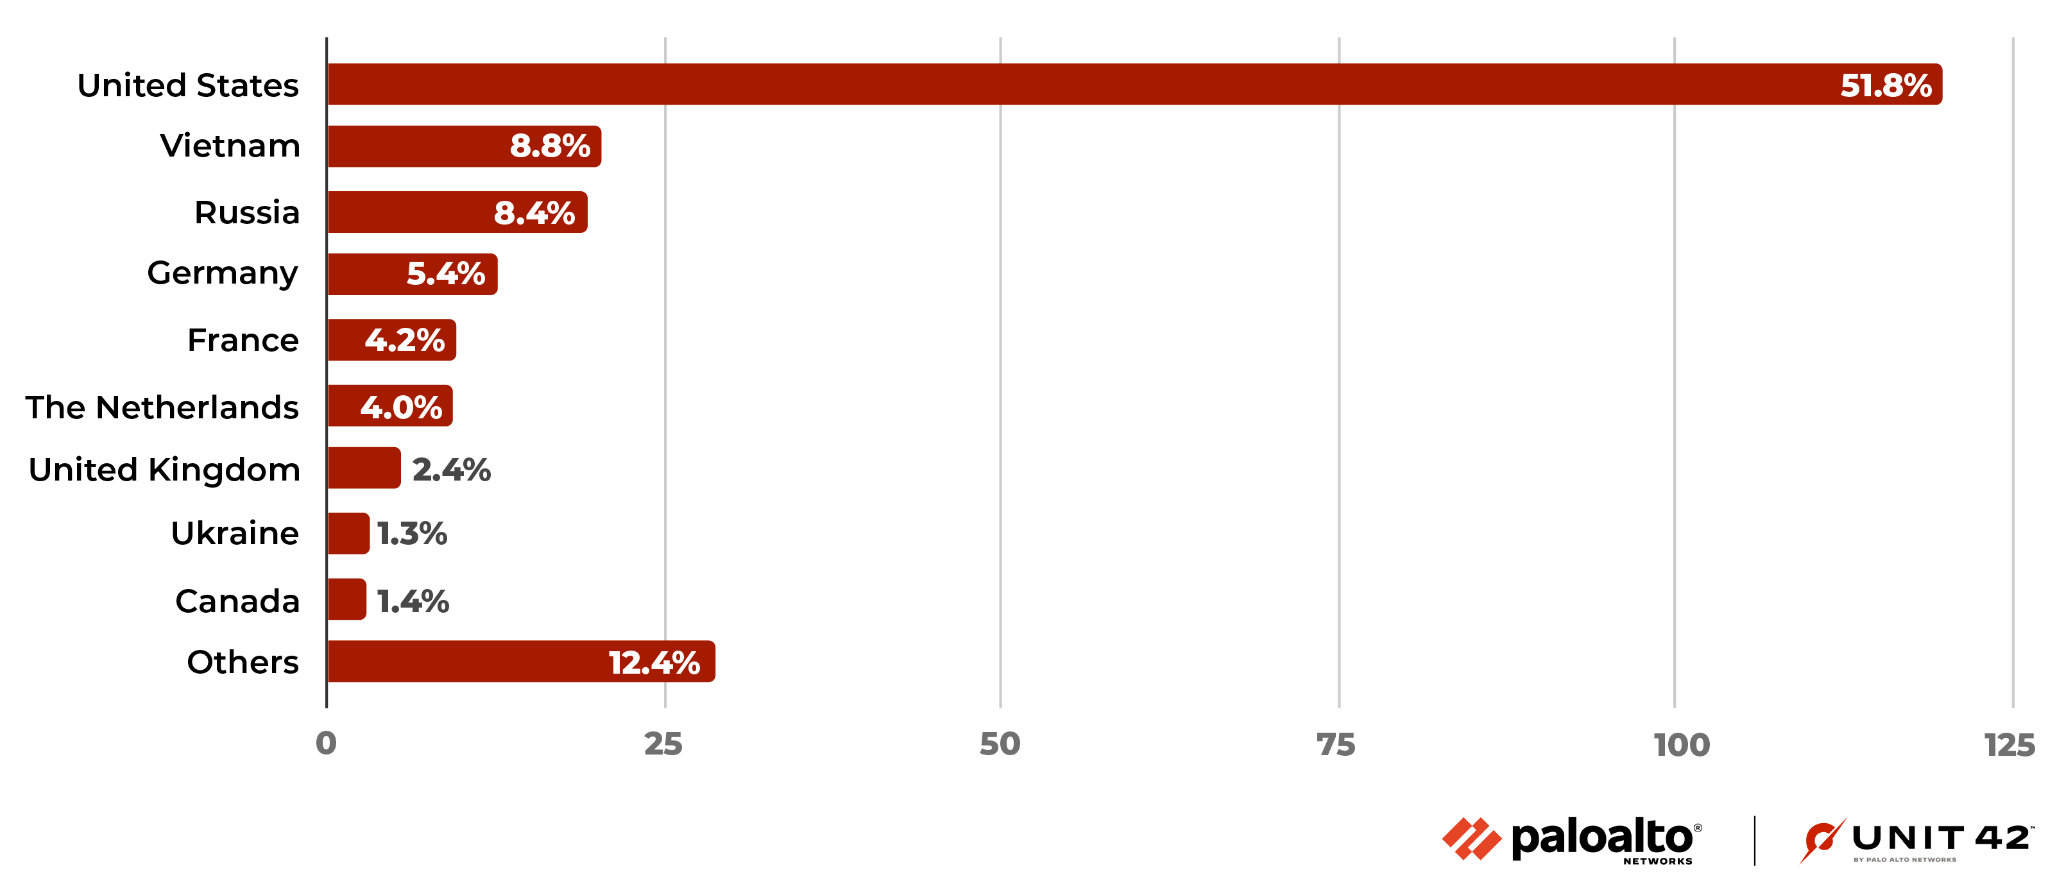
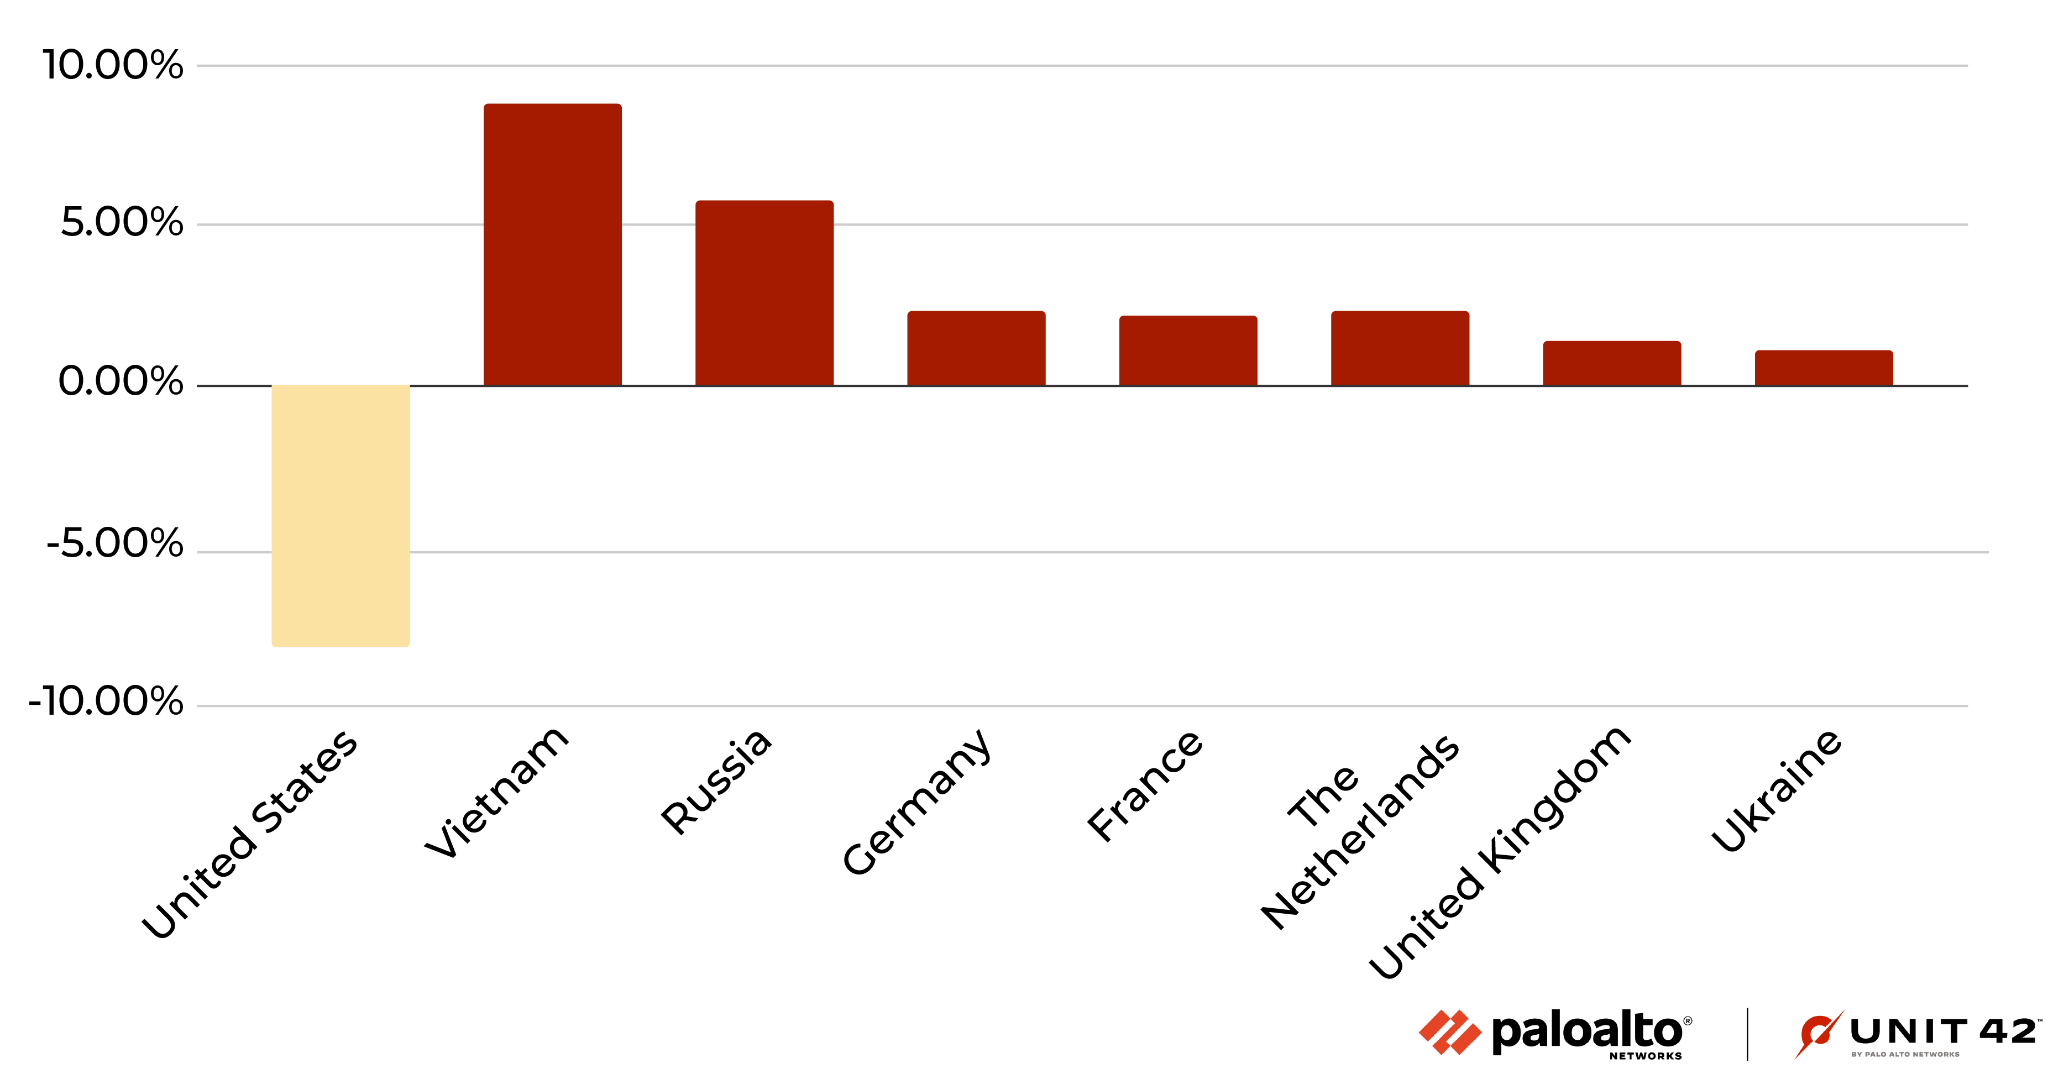
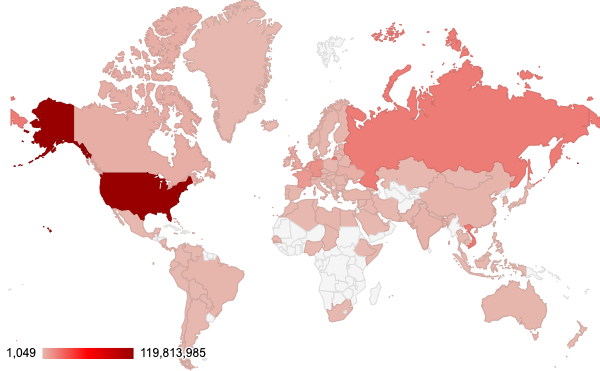
Where Did the Attacks Originate?
After identifying the region from which each network attack originated, we discovered that the majority of them seem to originate from the United States, followed by Vietnam then Russia. Attacks from Vietnam increased significantly this quarter. However, we recognize that the attackers might leverage proxy servers and VPNs located in those countries to hide their actual physical locations.
Conclusion
The vulnerabilities disclosed from August-October 2022 indicate that web applications remain popular targets for attackers, and that critical vulnerabilities are more likely to have PoCs publicly available.
In the meantime, we continue to capture newly published vulnerabilities that are exploited in the wild. This emphasizes the need for organizations to promptly patch their systems and implement security best practices. Attackers continue to make a concerted effort to expand their tool kit of exploits whenever possible.
While cybercriminals will never cease their malicious activities, Palo Alto Networks customers receive protections from the attacks discussed in this blog through the Next-Generation Firewall and Cloud-Delivered Security Services, including Threat Prevention, WildFire and Advanced URL Filtering, as well as through Cortex XDR.
To further mitigate any risks to your network:
- Run a Next-Generation Firewall to identify where your configuration could be altered to improve your security posture.
- Run a Security Lifecycle Review to get a consolidated view of your largest threats and if you have coverage to prevent them.
- Continuously update your Next-Generation Firewalls with the latest Palo Alto Networks Threat Prevention content (e.g., versions 8649 and above).
- Prisma Cloud customers using WAAS receive protection from these threats through the App Firewall feature, which detects attacks such as cross-site scripting, SQL injection, directory traversals and more.
Additional Resources
- Top CVEs to Patch: Insights from the 2022 Unit 42 Network Threat Trends Research Report
- Network Security Trends: May-July 2022
- Network Attack Trends: February-April 2022
- Network Security Trends: November 2021 to January 2022
- Network Security Trends: August-October 2021
Table of Contents
Related Vulnerabilities Resources


 High Profile Threats